We are glad to share a new case study story from the Perfect Widgets customer who uses it to show oceanographic data in an attractive and understandable manner.
Organization Overview
Gulf of Mexico Coastal Ocean Observing System (GCOOS) is one of 11 regional associations of US Ocean observing systems.
The GCOOS Office is housed within the Department of Oceanography at Texas A&M University in College Station, TX.
In brief, our goal is to aggregate oceanographic data from a myriad of small data providers and make it easy for the public to access and use.
Challenge
We need to show our near-real time ocean observing data and present it in ways that are easy for the layman and general public to grasp quickly. The general public is familiar with speedometers, thermometers, dials and similar common gauges. These are particularly useful on our education and outreach pages which are designed for the non-scientific community. Perfect Widgets helped us do this.
We have a very limited number of developers for our products page. To save our time and focus on our primary purpose, it is necessary to use a well-organized, easy-to-use, and beautiful JavaScript gauge library. The Perpetuum product is one of the best libraries we were looking at.
Solution
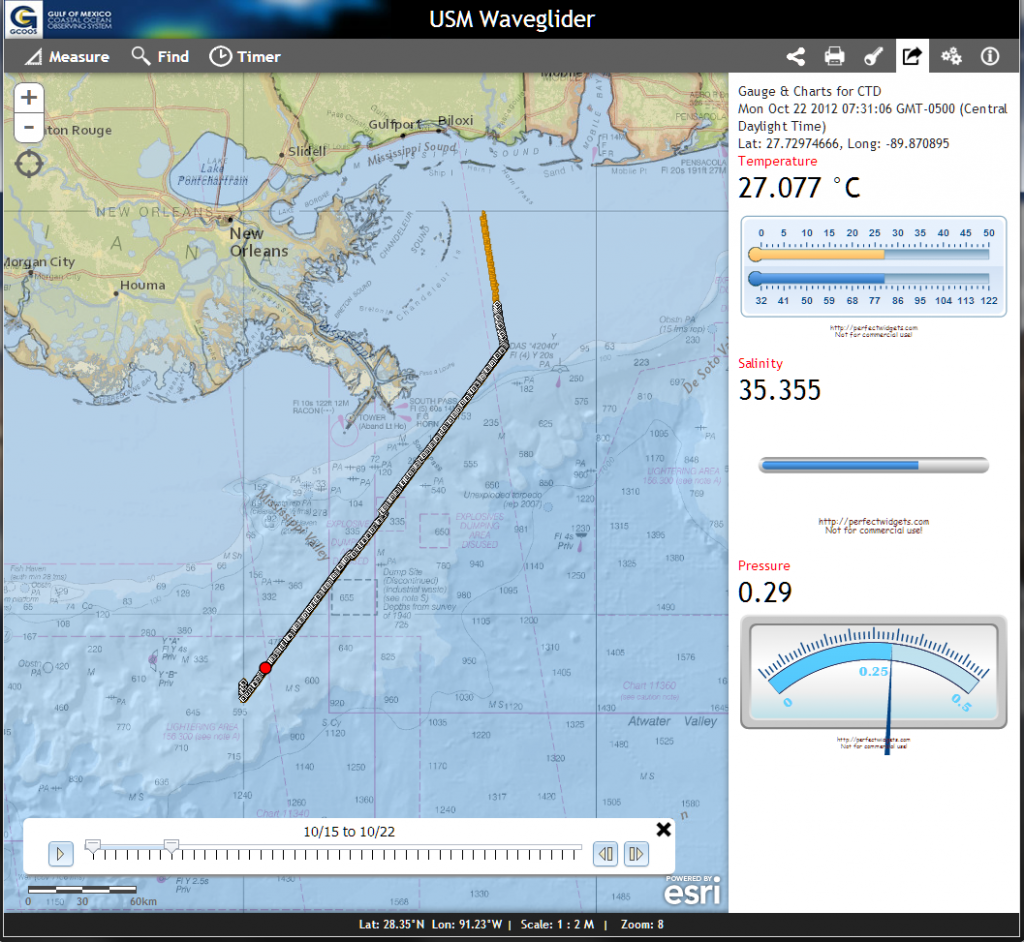
We added a module to our web-based application USM Waveglider showing critical indications as well-known and familiar gauges. CTD’s located all over the Gulf of Mexico transmit the following data: temperature, salinity and pressure. With Perfect Widgets gauges they are easily visualized and provided to the public in an attractive and understandable manner.
Benefits
Pre-defined widgets and easy customization are key to develop our products.
Beautiful design as well as simpler implementation save a lot of our developing time and provide good visualization of scientific data.
Download Perfect Widgets free trial to see how it is easy to monitor your data in web-based applications!