In this example we will show how to use MS Charts in Report Sharp Shooter.
In order to use MS Charts in Report Sharp-Shooter, the project should be built on.NET 4.0.
- Create a new project in Visual Studio. Set .Net Framework to 4.0
Note: .Net Framework 4.0 (Client Profile) cannot be used for this purpose.

- Add the MsChartSupport and the ReportManager components from the Report Sharp-Shooter group on the toolbox.

-
Use the untyped dataset as a data source for this example. Add the DataSet component from the Data group on the toolbox.
- Create a table in the added DataSet. Set Name = tempOfSalesTable, TableName = TempOfSales.

- Add the following columns: Year and Value are of the Int32 type.
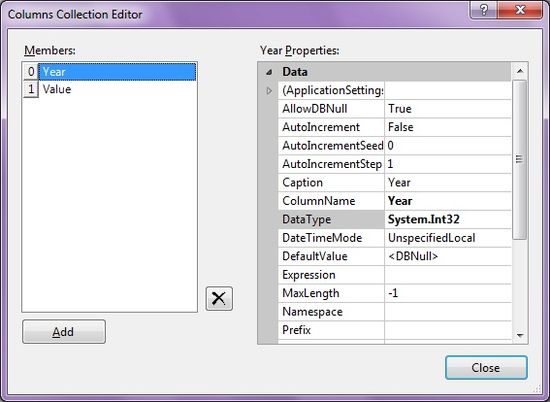
- Fill the DataSource with random information for a period from 2000 till current year-1. Add the FillDataSource function for this purpose:
public Form1()
{
InitializeComponent();
FillDataSource();
}
private void FillDataSource()
{
// Let's add some data
Random random = new Random();
for (int year = 2000; year < DateTime.Now.Year; year++)
{
DataRow row = tempOfSalesTable.NewRow();
row["Year"] = year;
row["Value"] = random.Next(1000);
tempOfSalesTable.Rows.Add(row);
}
} - In the ReportManager on the Data sources tab, add a new datasource with “tempOfSales” name. Set the “tempOfSalesTable” as the Value.

-
Add a new InlineReportSlot on the Reports tab. Click “Run Designer”. Add a new blank report.
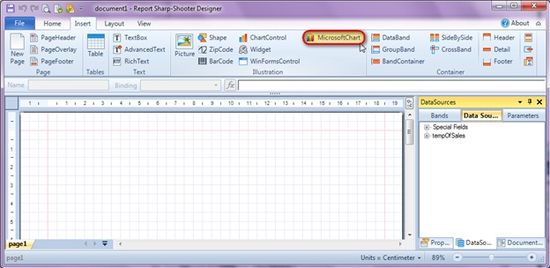
- On the Insert tab, select the MicrosoftChart element and add it on the page.

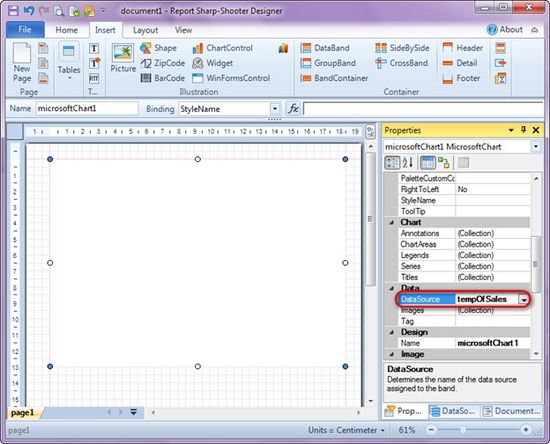
- Select the “tempOfSales” as the DataSource property value.
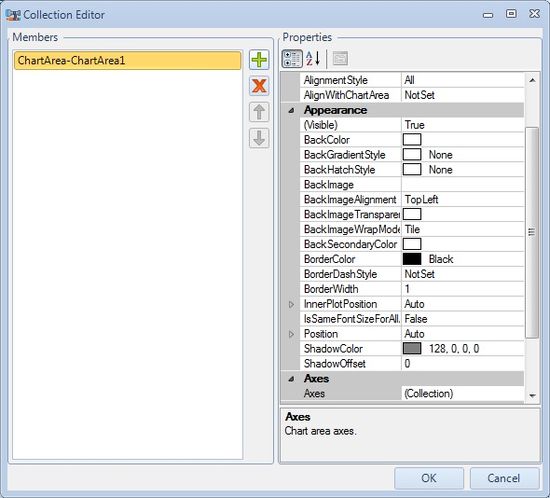
- Open the ChartAreas collection and add a Chart Area, keeping all the default parameters.
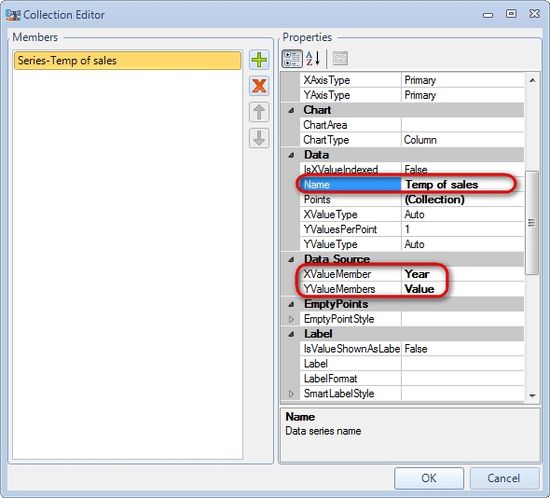
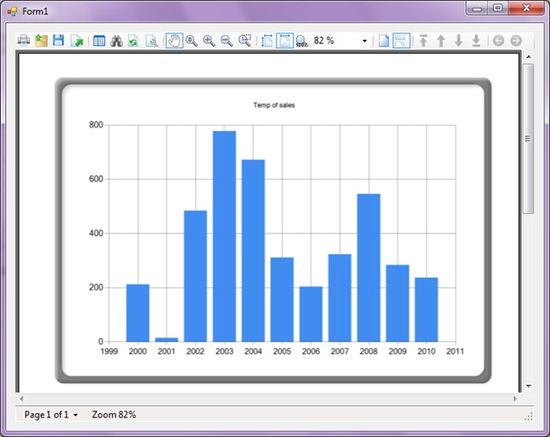
- Open the Series collection and add a series. Select “Year” as XValueMember, “Value” as YValueMember, set Name = Temp of sales. The ChartArea is set automatically as “ChartArea1″ after the editor is closed.
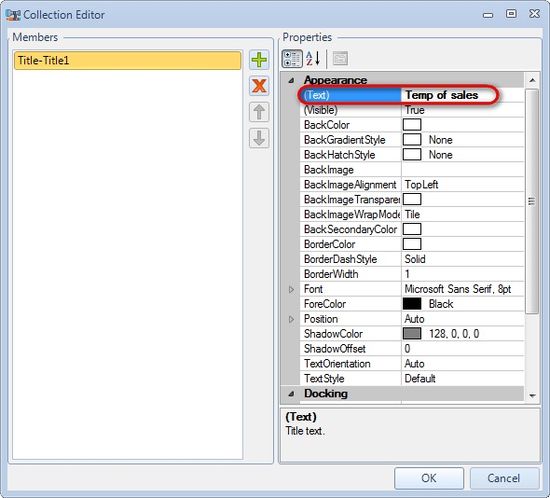
- Open the Titles collection, add a new Title, set Text = Temp of sales.
- Open the Titles collection, add a new Title, set Text = Temp of sales.
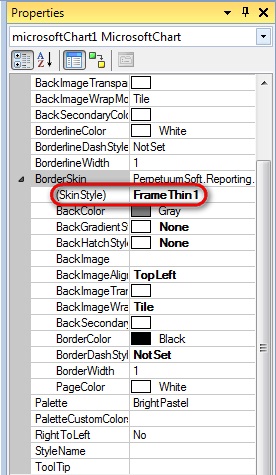
- Select the “FrameThin1″ as the BorderSkin.SkinStyle.
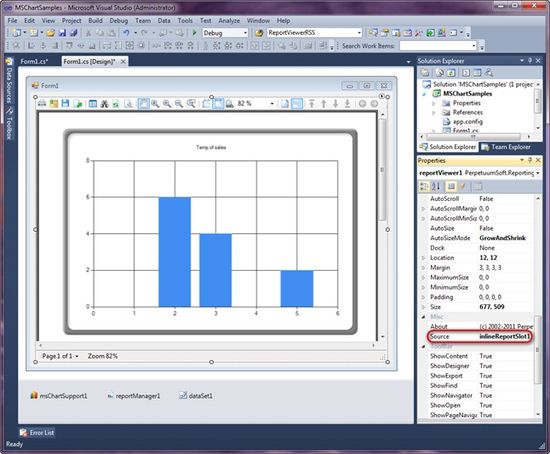
- Add the ReportViewer to the form, set the Source to the inlineReportSlot1.
- In order to display the report on the startup, add the form’s Load event handler :
private void Form1_Load(object sender, EventArgs e)
{
inlineReportSlot1.Prepare();
} - Run the application.
Configuring charts in Report Sharp-Shooter scripts.
Here is some important information a developer should know in order to successfully work with Microsoft Charts using Report Sharp-Shooter scripts:
The implementation of Charts in Report Sharp-Shooter isn’t our own implementation. It uses standard charts in the System.Windows.Forms.DataVizualization.Charting.Chart library. A “wrapper” for all used classes is implemented for support integration. It allows a user to use Charts inside Report Sharp-Shooter. Most of the wrapper-classes are inherited from the standard classes and they add interfaces to Report Sharp-Shooter. Therefore there are some requirements in order to successfully use the Charts.
Use the PerpetuumSoft.Reporting.MSChart.ChartModel namespace with the same type names instead of the System.Windows.Forms.DataVisualization.Charting namespace.
Try to avoid the use of functions used to add objects into collections that automatically create an object. In this case the object of a standard type will be created instead of the wrapped object.
It is not recommended to configure a chart using scripts if there is a possibility to do this without scripts.
An example of configuring a chart using scripts.
In order to configure the chart using scripts as described above, use the following code. For example, in the GenerateScript of a chart you should have the following:
PerpetuumSoft.Reporting.MSChart.ChartModel.ChartArea chartArea = new PerpetuumSoft.Reporting.MSChart.ChartModel.ChartArea();
chartArea.Name = "ChartArea1";
microsoftChart2.ChartAreas.Add(chartArea);
PerpetuumSoft.Reporting.MSChart.ChartModel.Series series = new PerpetuumSoft.Reporting.MSChart.ChartModel.Series();
series.Name = "One more series";
series.XValueMember = "Year";
series.YValueMembers = "Value";
microsoftChart2.Series.Add(series);
PerpetuumSoft.Reporting.MSChart.ChartModel.Title title = new PerpetuumSoft.Reporting.MSChart.ChartModel.Title();
title.Text = "Temp of sales";
microsoftChart2.Titles.Add(title);
microsoftChart2.BorderSkin.SkinStyle = System.Windows.Forms.DataVisualization.Charting.BorderSkinStyle.FrameThin1;