Those who assiduously followed the articles on this blog, have probably already grasped the irresistible fun of creating reports with SharpShooter
But once you started, it won’t take much time to find out that interactive reports can be even more fun. Lend fresh perspectives, let the users choose what they want to see!.. And if this sounds compelling enough, feel free to read on. In this post you will learn:
- how to use parameters in reports, and how to refresh a report after a parameter gets changed
- how to use ReportViewer control
- how to create a dynamic report via scripts and why one might need GenerateScript property of a document
- and a few other things
- and you will build a sample report application looking like this:
Problem statement.
Remember Google Trends app, where you can study the search trends about everything? For example, analyze how people search for different programming languages:
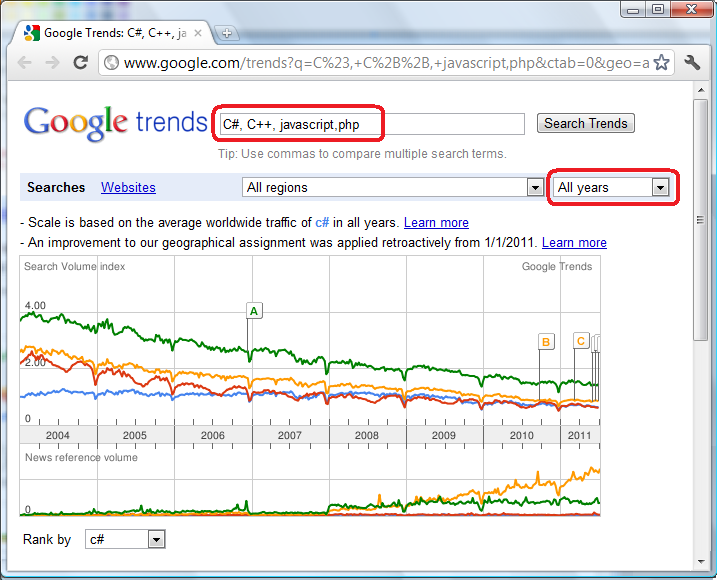
Note that the page above is kinda interactive: you can select different years from the dropdown, or update the request string – say, remove “C#” from the list – and see the updated result.
Our application will do the same: we’ll download the above data from Google Trends, display it in ReportViewer, and provide a checkbox (to add/remove C# results) and a dropdown (to control the dates range for all results).
The screenshot of the end result has been already presented above, now you might want to grab the source code from BitBucket and play around, and in the next sections I’d quickly go through the implementation.
Implementation.
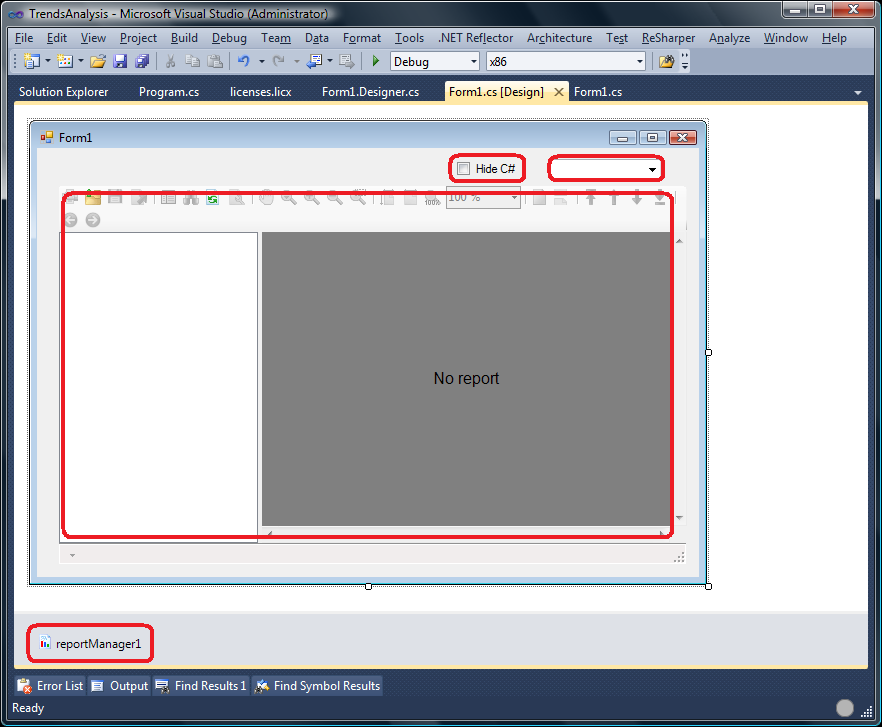
Getting data from Google Trends is easy enough: they allow to export the page in .csv format, and we just need to convert that to .xml file. Then we create a new WinForms application, and drag-n-drop a few items on the main form:
- ReportManager component to control report generation (create a FileReportSlot within the manager, to contain report layout details)
- ReportViewer component to display the report directly on the form
- CheckBox to turn on/off C# results
- ComboBox to filter the results by year
Now pause for a moment. Somehow we should pass the values of the checkbox and dropdown to our report – each time they get changed the report should reflect the change. This will be done by the following event handlers:
   private void GetReportParameters(object sender, GetReportParameterEventArgs e)
   {
       e.Parameters["year"].Value = (cmbYears.SelectedIndex == 0)
            ? null
            : cmbYears.SelectedItem;
       e.Parameters["hideCSharp"].Value = chkHideCsharp.Checked;
   }

   private void cmbYears_SelectedIndexChanged(object sender, EventArgs e)
   {
       reportViewer.RefreshReport();
   }

   private void chkHideCsharp_CheckedChanged(object sender, EventArgs e)
   {
       reportViewer.RefreshReport();
   }
The first method applies the values of the checkbox and dropdown to “year” and “hideCSharp” report parameters (more on that later). The next two guys simply refresh Report Viewer each time their values get changed.
Now we need to attach the handlers. The last two are the ones you normally attach from Visual Studio by double-clicking on a component, but you probably want to attach the first one explicitly in code:
   public Form1()
   {
      InitializeComponent();

      reportSlot.GetReportParameter += GetReportParameters;
      cmbYears.SelectedIndex = 0;
   }
That’s pretty much it for coding, now we double-click on the ReportManager to open up its editor, select our FileReportSlot from the list, bring up Report Designer – and move on to the next part of our exciting journey!
Report Designer.
In Report Designer, we create a new blank report and set an Xml Data Source for it:
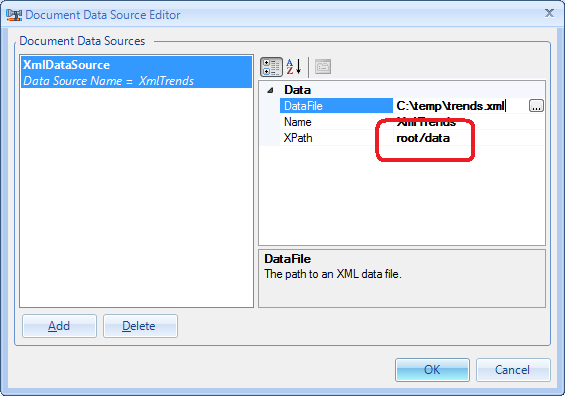
The values are straightforward, although XPath probably needs explanation. Here’s how our converted xml looks like:
<?xml version="1.0" encoding="utf-8"?>
<root>
  <data week="Jan 4 2004">
    <csharp deviation="2%">0.94</csharp>
    <cpp deviation="2%">2.08</cpp>
    <javascript deviation="2%">2.52</javascript>
    <php deviation="2%">3.54</php>
  </data>
  ...
</root>
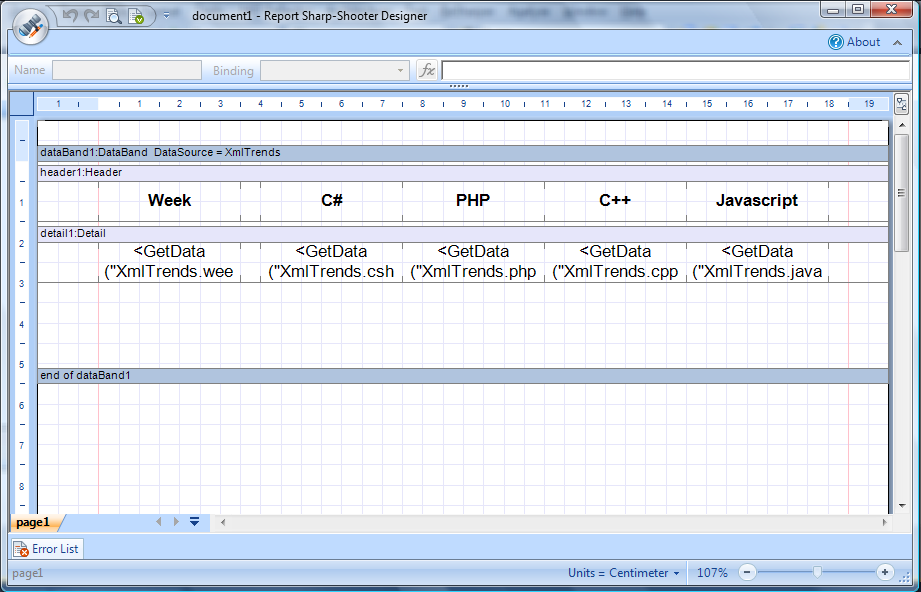
As you can see, the XPath entered in the dialog box is exactly the one we need to access the data elements. And now, as the data source is ready, we build up the skeleton of the report: headers and data columns:
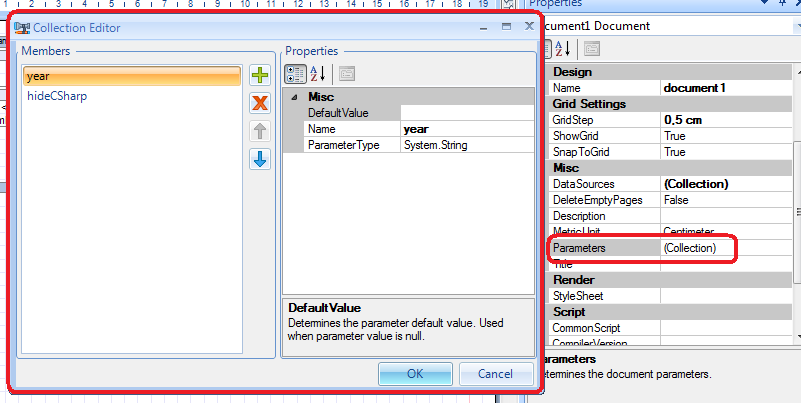
Woo-hoo, looks like we’re doing very well. Everything is ready for interactivity – let’s trot out the parameters! In the document we select Parameters and add the two guys I already mentioned before:
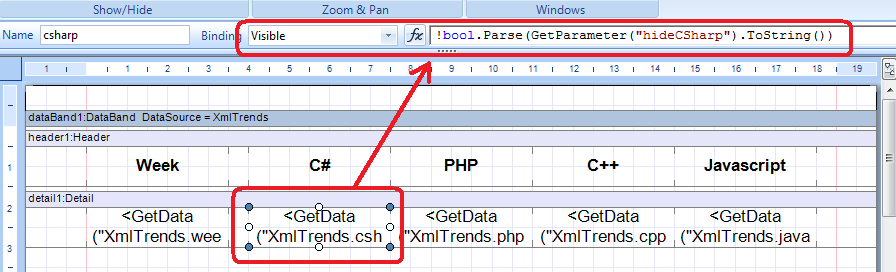
The rest is simple enough: as we want to hide C# values, the corresponding textbox should have its Visible binding set to a function (the same counts for the header textbox):
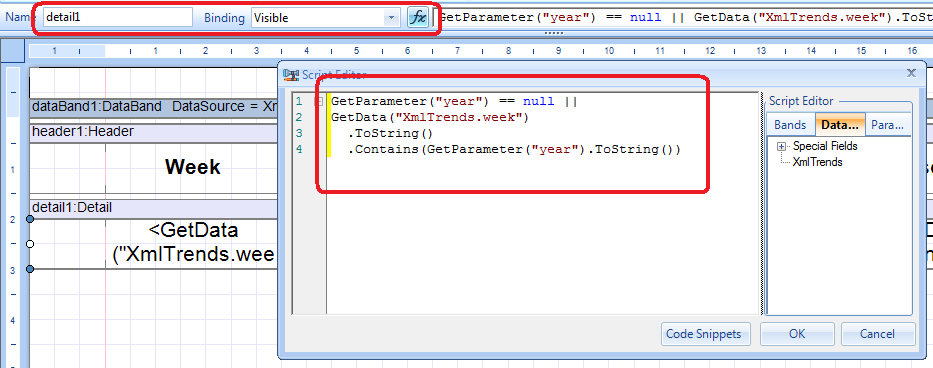
And as we want to filter out the results by year (remember the “year” dropdown), the similar filtering should be applied to the whole Detail section. We want the section to shine in all its beauty only if year not selected or if the date value contains the selected year:
That’s pretty much it, congratulations! The only thing left is improving the layout: we don’t really want to “just hide” C# column – other columns should get realigned to cover the empty space. In the same way, when C# results are back, the columns should get realigned again. This kind of things is normally done in GenerateScript property of a document.
Main script of the document.
GenerateScript of any element is the place where you put the code you want to run when the element gets rendered. As our task is to realign the elements for the whole document, the document’s GenerateScript seems like a good place.
If C# results are hidden, the spacing between the remaining columns gets bigger (and if all results get displayed, the spacing gets smaller). Hence, there’s some multiplier, different for both cases, which should be applied all the time. To cut a long story short, here’s the code:
    bool hideCsharp = bool.Parse(GetParameter("hideCSharp").ToString());
    double delta = hideCsharp ? 4.3 : 3.5;

    TextBox[] headers = new TextBox[] {headerWeek, headerCsharp, headerPhp, headerCpp, headerJavascript};
    TextBox[] values = new TextBox[] {week, csharp, php, cpp, javascript};

    for (int i = 0; i < headers.Length; i++) {
        headers[i].Location = new Vector(1.5 + i*delta, 0).ConvertUnits(Unit.Centimeter,Unit.InternalUnit);
        values[i].Location = new Vector(1.5 + i*delta, 1).ConvertUnits(Unit.Centimeter,Unit.InternalUnit);
    }

    if (hideCsharp) {
        headerJavascript.Location = headerCpp.Location;
        headerCpp.Location = headerPhp.Location;
        headerPhp.Location = headerCsharp.Location;

        javascript.Location = cpp.Location;
        cpp.Location = php.Location;
        php.Location = csharp.Location;
   }
One important thing to mention, is that in calculations like this we should always convert the units to "internal units". Even though I personally think it's not necessary (the system can identify it based on MetricUnit property of the document) but SharpShooter developers decided to require the explicit form, because in a complex report such "automated guesswork" can potentially wreak havoc.
Summary.
Making interactive reports requires very little coding in Visual Studio - basically, you only hook event handlers for setting report parameters, and the rest is done in Report Designer by coding Visible property of an element.
Having read this post, you can now create dynamic reports which will hide/show data based on user's preference - and you even can do it in a nice-looking way by realigning the sections in GenerateScript of your document.
Feel free to download the source code of the sample app here. Happy reporting!