The other day Darina wrote a fascinating post about using Microsoft Charts in Report SharpShooter. For obvious reasons, this feature is only available for SharpShooter 5.3+ so it’s also an enormous incentive to upgrade
Your humble correspondent would like to carry on exploring, and show you how to create a report with MSChart in just two minutes – using the open source PowerShell script I occasionally promote on this blog.
In this post, we will
- create a report with New-Report command
- make a few tweaks in Report Designer to display a chart
- and show the report with Show-Report command
Not that there’s something wrong with doing the same thing from Visual Studio, but The Powershell Way is much faster.
Which chart to display.
Well, we need something interesting to reflect on our chart. How about the “Three Door” puzzle?

Suppose you’re given the choice of three doors: behind one door is a car, behind two others are goats. After you choose a door, someone who knows where’s the car, opens an unchosen door which reveals a goat. Now you can either switch to the other closed door, or stay with the one you’ve picked originally. The question is, obviously, is it to your advantage to make the switch?
If you didn’t know the game, now you might want to think about it for a while. Take your time – this post will still be here when you’re back. And I will creatively reveal the correct answer with a chart on a SharpShooter report, displaying the number of people who won if switched, and those who lost if switched.
Preparing the data.
The puzzle is so intriguing that it inspired a TV show (which ran for 27 years!), a few vehement discussions in newspapers, and a number of computer simulations which showed, that the right strategy is.. uh oh, I promised to tell you later.
But we will reuse the data from one of these computer simulations. Here’s the pdf which contains a spreadsheet with the results of the modelling (it also contains the correct answer and the explanation, so you’re warned!)
Our report will read data from SQL Server, so we’ll create a table and fill it with the data from the above pdf.
CREATE TABLE ThreeDoors (
	Game INT NOT NULL,
	Switch NVARCHAR(4) NOT NULL,
	NoSwitch NVARCHAR(4) NOT NULL
)

INSERT INTO ThreeDoors(Game, Switch, NoSwitch)
VALUES
	(1, 'Win', 'Lose'), (2, 'Lose', 'Win'), (3, 'Win', 'Lose'),
	(4, 'Win', 'Lose'), (5, 'Lose', 'Win'), (6, 'Win', 'Lose'),
	(7, 'Win', 'Lose'), (8, 'Lose', 'Win'), (9, 'Win', 'Lose'),
	(10,'Lose', 'Win'),(11, 'Win', 'Lose'),(12, 'Win', 'Lose'),
	(13,'Lose', 'Win'),(14, 'Win', 'Lose'),(15, 'Win', 'Lose'),
	(16,'Lose', 'Win'),(17, 'Win', 'Lose'),(18, 'Win', 'Lose'),
	(19,'Lose', 'Win'),(20, 'Win', 'Lose'),(21, 'Win', 'Lose'),
	(22,'Win', 'Lose'),(23, 'Win', 'Lose'),(24, 'Win', 'Lose'),
	(25,'Lose', 'Win'),(26, 'Win', 'Lose'),(27, 'Win', 'Lose'),
	(28,'Lose', 'Win'),(29, 'Win', 'Lose'),(30, 'Win', 'Lose'),
	(31,'Lose', 'Win'),(32, 'Lose', 'Win'),(33, 'Lose', 'Win'),
	(34,'Win', 'Lose'),(35, 'Lose', 'Win'),(36, 'Lose', 'Win'),
	(37,'Win', 'Lose'),(38, 'Lose', 'Win'),(39, 'Win', 'Lose'),
	(40,'Win', 'Lose'),(41, 'Lose', 'Win'),(42, 'Lose', 'Win'),
	(43,'Lose', 'Win'),(44, 'Win', 'Lose'),(45, 'Win', 'Lose'),
	(46,'Win', 'Lose'),(47, 'Win', 'Lose'),(48, 'Win', 'Lose'),
	(49,'Win', 'Lose'),(50, 'Win', 'Lose')
I’m inserting the entries in a “SQL Server 2008″-like syntax, if you’d like to repeat my steps on the earlier versions, you’d need to use the less fancy plain inserts.
And now we need a query to retrieve the total number of the lucky beggars who won if switched, as well as the ill-starred souls who lost if switched. This shouldn’t be too difficult:
SELECT
   SUM(CASE WHEN Switch = 'Win' THEN 1 ELSE 0 END) AS 'SwitchAndWin',
   SUM(CASE WHEN Switch = 'Lose' THEN 1 ELSE 0 END)AS 'SwitchAndLose'
FROM ThreeDoors
(Remember those “SwitchAndWin” and “SwitchAndLose” guys – we’d need them later). That’s it, we’re ready to create a SharpShooter report!
Creating a SharpShooter report via PowerShell.
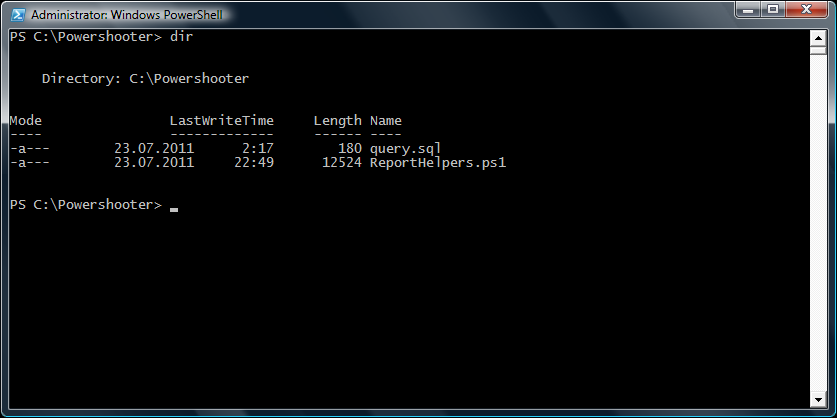
So what we do now, we save the retrieval query to a file – say, query.sql – and copy the open source ReportHelpers.ps1 script to the same folder. Here’s what we get:
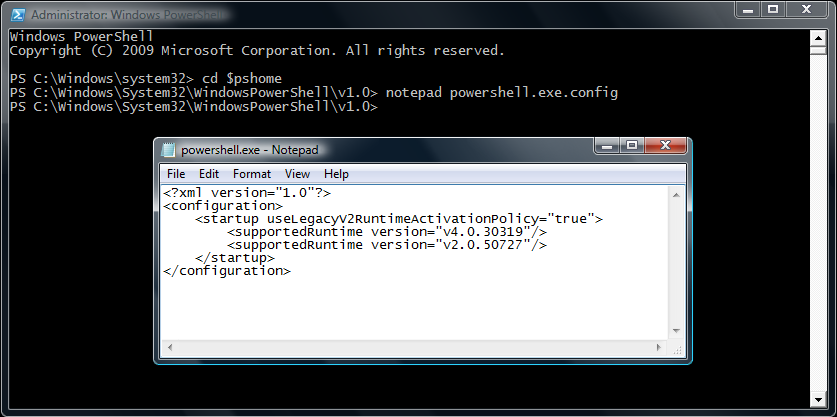
That would be enough to create a casual report, as I showed in previous posts, but this time we need MSChart – which runs on .NET4 only. And now Houston we have a problem, for the PowerShell console runs against .NET3.5 by default, so we need to force it to run against .NET4. Which is normally done by applying this config:
<?xml version="1.0"?>
<configuration>
    <startup useLegacyV2RuntimeActivationPolicy="true">
        <supportedRuntime version="v4.0.30319"/>
        <supportedRuntime version="v2.0.50727"/>
    </startup>
</configuration>
We’d need to save the above xml as powershell.exe.config in the PowerShell install folder (so that the config lies right next to the executable, powershell.exe):
The above was the only roadblock on our way to the charting paradise. Once it’s solved, here’s what we do:
- include the script with . .\ReportHelpers.ps1 (after that we can use the functions defined there). Note that it’s “dot space dot backslash” followed by the script name!
- kick off New-Report -query:”C:\Powershooter\query.sql” -chart which will create a new report with data retrieved via the query we provide (and -chart is a switch telling that we want a chart to be pre-created on the report)
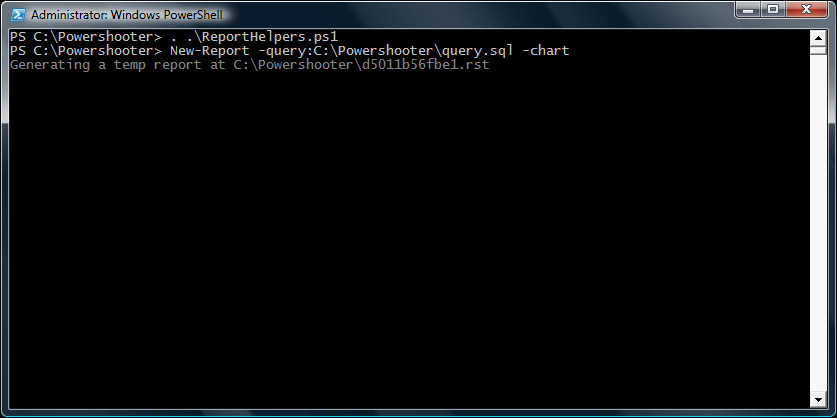
As you can see, the script saves the report under a temporary name, which we can obviously overwrite at any time. And then Report Designer shows up, and lo and behold, there’s a pre-created chart on the report!
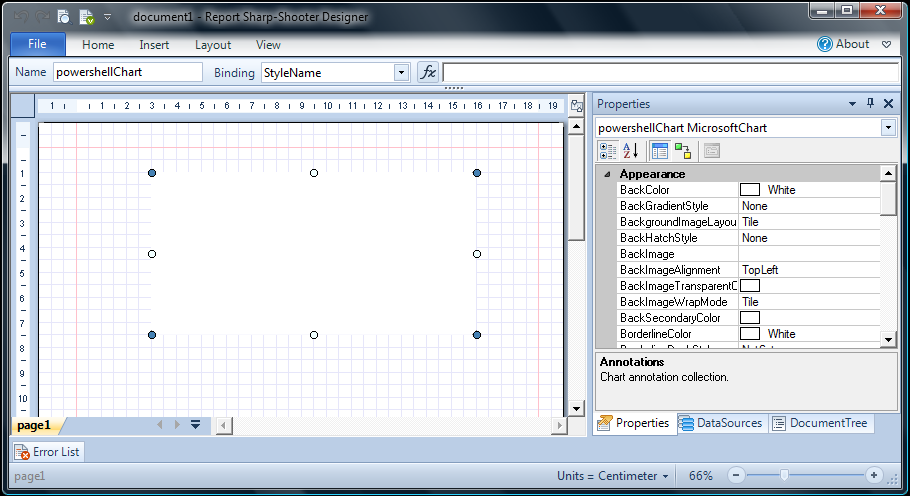
Tweaking MSChart in Report Designer
Well, the script didn’t try to guess which data series we want in the chart – it would have been too complicated to implement for a general case. So we need to set that up manually. Let’s make a standard “column chart” with two bars, one telling how many people won if they switched, and the other one showing how many people lost if they switched.
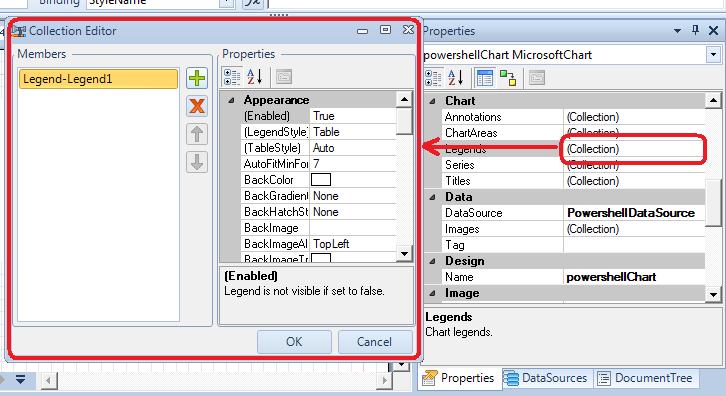
So first off, we go to Legends property of the chart and setup a default legend:
Then we go to Series property, and create two entries. They’re both pretty similar:
- we select chart area which will hold the series (the script pre-created a default one for us)
- give them meaningful names, which will be displayed on the legend
- and tell where to get the values from

Just to recap: on the image above, we tell the designer that X axis is the series itself (we’d like to display only two bars), so we leave XValueMember blank, and we tell YValueMembers to get the values from SwitchAndWin (or SwitchAndLose) of the data source. Essentially, into those YValueMembers we put the names from the resultset of the SQL query we use (check out query.sql if you need a refresh).
That’s it. Save the report, close it, and run the viewer from powershell:
Show-Report "C:\Powershooter\d5011b56fbe1.rst"
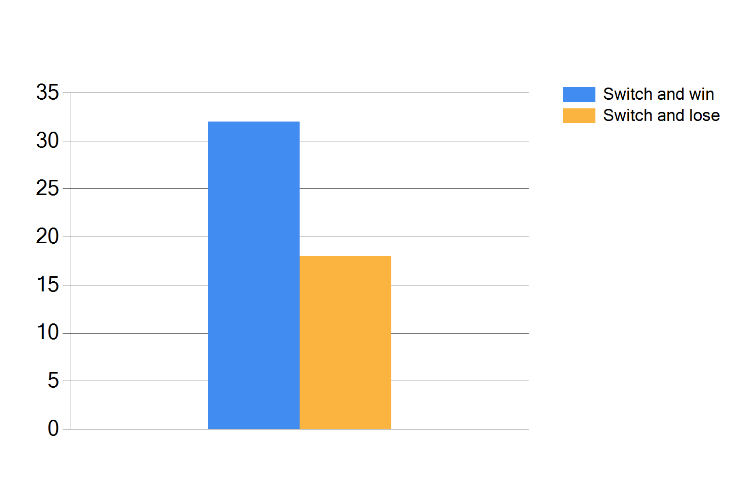
And here’s your result:
Summary.
Even though this post seems lengthy enough, as I tried to explain it in a great detail, creating a report with MSChart is extremely easy if you use the powers of this script.
You only need to come up with a SQL query which would return the results you need, and run this command: New-Report -query:”path/to/query.sql” -chart. When the Report Designer opens up, it will have the chart pre-created, with Data Source and Chart Area already set up, so you’ll only need to tell the designer how you want your data series to look like.
In the similar fashion, to show an already generated report, you use Show-Report “path/to/file.rst” command.
I also hope that you liked the “Three Door” puzzle and its seemingly counter intuitive answer! The odds are 2 to 1 that you’re better off switching, and our chart (or, better yet, computer simulation results we reused ![]() ) clearly proves that. If you’re amazed – or infuriated – with such results, let me know in comments!
) clearly proves that. If you’re amazed – or infuriated – with such results, let me know in comments!