If you follow this blog, you’ve probably heard of an inspiring series of posts about characteristics of a successful software product by Mikhail Payson – a series which would redound to the benefit of your budding apps, if you read carefully.
Now, your humble correspondent wants to piggyback on the topic with a small essay which may provide you a good excuse if you haven’t yet done any improvements to your product despite Mikhail’s write-ups
Thing is, success is random. You can do everything and the kitchen sink and fail. Or you can do little and succeed. And so forth and vice versa. Explanations why XYZ hit big exist only in hindsight.
How random is success: common sense.
First of all, success is random from a philosophical point of view: a great idea spawns many copycats, and the “algorithm” which had boosted the original product would cease to work when the clones start to crop up.
But that’s a well known hand-waving argument, and in case you’re looking for another one to impress your friends at a cocktail party – here it goes, right in this post. A mathematical proof about randomness of a success.
(And, of course, we will use SharpShooter Reports to visualize our rigorous math, so stay tuned!)
How random is success: math.
Imagine (example inspired by The Drunkard’s Walk book) that you’re doing an immense marketing experiment: selling your new software product under two different brand names.
User interface, architecture, bugs, features and marketing – everything is completely the same. But people can buy either Product A or Product B. Which one will be more successful?
Given that both “products” are essentially identical, you may expect that the leader would normally seesaw and each app will be on a roll approximately half of the time. And if you don’t see a flaw in this logic, please read on – it will blow your mind.
So, with the chances of both brands being equal, one can mathematically model the problem this way: we would be tossing a {+1, -1} coin for each buyer and assign “+1″ to buying and preaching up Product A and “-1″ to buying and preaching up Product B.
Then, we just need to keep tabs on the cumulative sum of the coin toss outcomes to see who would end up being the leader. Here’s an example of coin tossing, to make the idea more clear:
- the first toss is “-1” so Product B is the leader
- the next toss is again “-1” so Product B outruns its rival by 2
- the next toss is “+1” (Product A starts to catch up) and Product B being still the leader, outperforms its rival by 1
- the next toss is again “+1” and there’s no leader, both products have equal number of “likes”
- the next toss is again “+1” and now Product A becomes the leader, outrunning it rival by one
- and so on
Then we count all occurrences where Product A was the leader and divide it by the total number of buyers, and store the resulting number.
With a lot (thousands) of simulations, the list of the above numbers will reasonably represent a “Product A being the leader” probability distribution – which we would visualize with SharpShooter Reports.
So, let’s look at some code!
How random is success: code.
First off we’d create a console application and install SharpShooterHistogram Nuget package for our visualization purposes:

Then, we’ll write code to run 1K simulations, store the leadership probabilities and display them as a histogram:
static void Main()
{
    var users = 100;

    var simulation = new Simulation(users);
    var results = Enumerable.Range(1, 1000).Select(x => simulation.GetLeaderProportion());

    var histogram = new HistogramDialog(results, users) {
        WindowState = FormWindowState.Maximized
    };
    histogram.ShowDialog();
}
For more details on how Simulation methods work please check out source code on BitBucket – it’s just a bit of math there – and here I’ll only share the final image generated by the Histogram plugin:
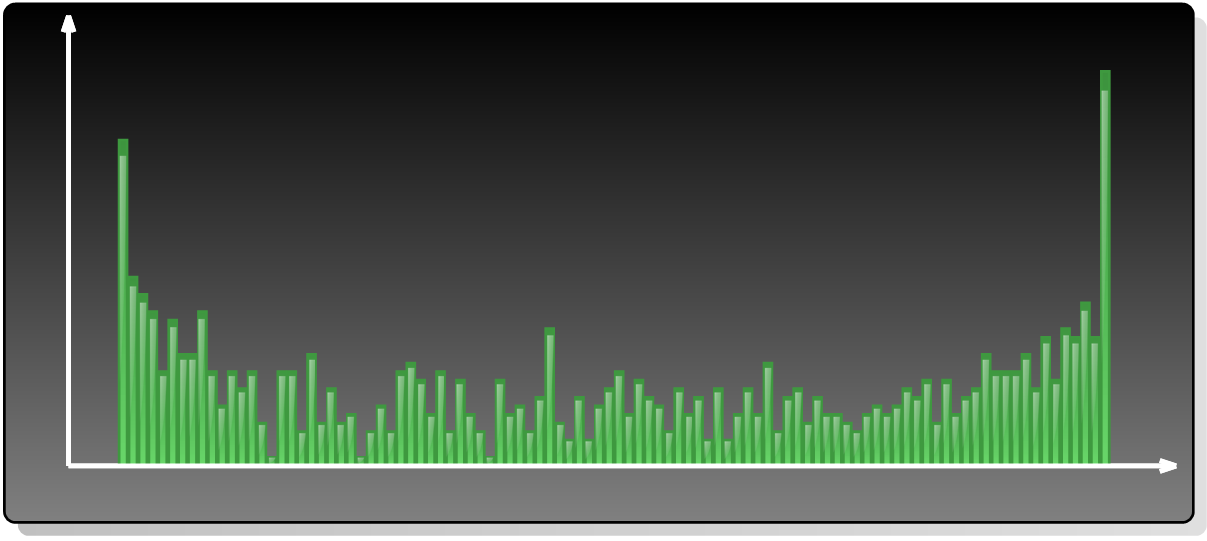
Lo and behold, the most probable result is that one product will become a leader and the other project (despite being absolutely identical) will never, ever, catch up.
Summary.
Our example proves that by pure chance a project can become a leader or loser, and there’s nothing you can do about it. And if you add psychology to the math model things will only get worse, because people are just more inclined to choose the leader, so in reality our probability distribution will be even more skewed.
Yet still there’s some good news.
A tried-and-true way to fight randomness does exist. It’s simple: increase the number of trials. “If you want to succeed, increase your failure rate”, as Tom Watson of IBM once put it. Randomness is, in some sense, stupid and by pure chance your next endeavour may hit big. Try running the simulator a few times to see: each time it will produce slightly different results.
..and, while running it, make a mental note how cool it is to use full power of SharpShooter Reports from a console app by writing just a few lines of code ![]()