Report Sharp-Shooter provides several ways for data retrieval, and the main question is, indeed, which approach is faster? Shall I use DataTables? Or custom entities? Or XML? All things equal, which report will generate earlier?
Some people don’t care about time and some applications are not time sensitive. But with reporting it’s often different: you generate tons of reports, use huge data sources.. no wonder lots of people are serious about performance and time. Some people indeed become obsessed with time like German philosopher Immanuel Kant who spent 30 years strolling up and down his veranda thinking about time.
And now compare 30 years to 10 minutes of reading this blog post, which will answer all your questions about time.. at least those related to Sharp-Shooter data sources!
(If you feel like 10 minutes is yet too much, and want to know the results of my perf test immediately – feel free to navigate right to Performance evaluation and summary section at the bottom of the post!)
Step 1 of 3. How to generate a lot of fake users.
So we plan to estimate which data source is more efficient – and to begin with, we need to generate a lot of fake data. Let’s use fakenamegenerator.com which is free and extremely quick: my data set was ready in 3 minutes. I opted to download a .sql script with 5.000 autogenerated tuples of {name, surname, telephone number, country, occupation}, and below you see how our final report looks like:
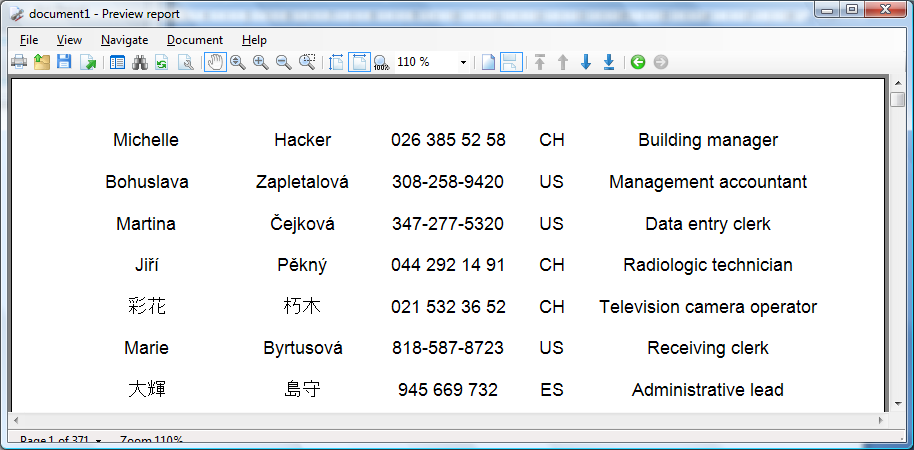
Nothing fancy, because we’re not interested in the report per se – we are interested in comparing the time differences between DataTable and XML data sources.
Step <unsettled>. A beginner’s guide to designing a report in Sharp-Shooter.
But before we move on to building DataTable/XML based reports, I’d like to quickly outline how to design a simple report in Sharp-Shooter. Hopefully, this will be good for someone, and if you are familiar with the topic – feel free to rewind to the next step!
At this point, we assume that Visual Studio part is fully done (data source is created, reportManager exists on the form, C# code to retrieve the data is implemented, etc – more on this in the next step). While still in Visual Studio designer, we double-click on reportManager to bring up “ReportManager editor” dialog. We double-click on a report slot listed there, and kick off Report Designer.
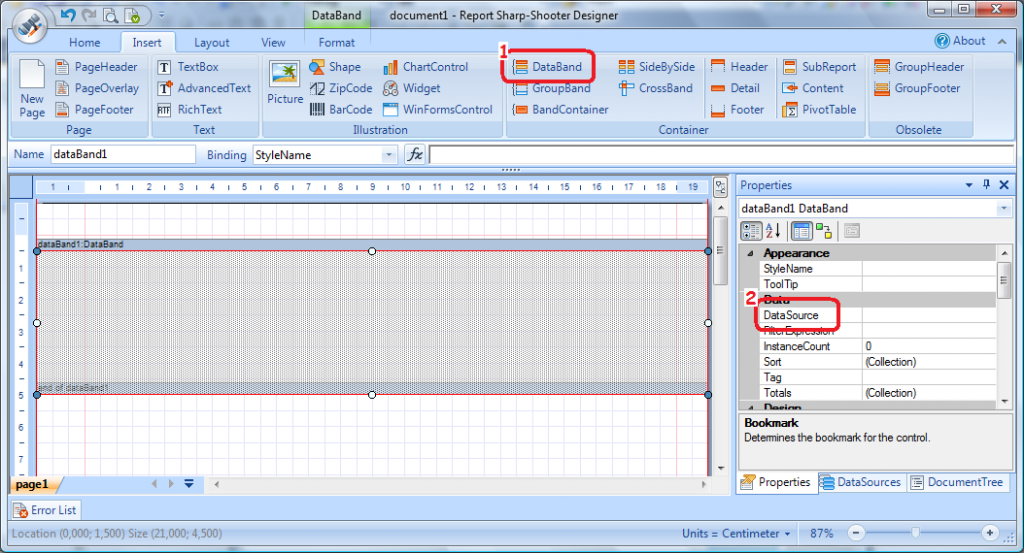
There we hit Ctrl+N to create a new report and start designing. So we wanna display all those 5.000 fake users, one by one, with all the details included. To do that, we drop a DataBand on the report (step 1 on the screenshot below, note that drag-n-drop doesn’t work: you’ll need to click on the control icon and then click again on the report sheet). Once the band is positioned nicely, we select the data source for it (step 2 on the screenshot below):
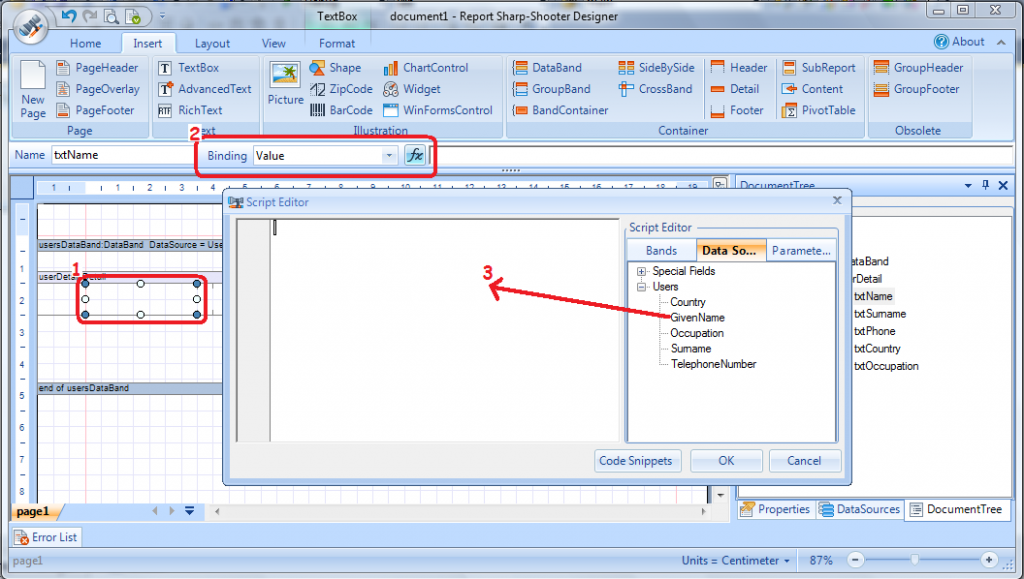
Now we put Detail element onto the DataBand, and then drag a number of textboxes there. Each textbox will contain a value from data source, and on the screenshot below you can see how to achieve that. We navigate to a textbox, select “Value” in Binding dropdown, and click on the f(x) sign nearby, to bring up the “Script Editor” dialog. Then we drag-n-drop the corresponding data item onto the editor pane:
Alternatively, we can bypass the editor dialog and type the script right into the script line (next to the f(x) button on the screenshot above). Thus, for txtName we could have typed GetData(“Users.GivenName”), for txtPhone we would put GetData(“Users.TelephoneNumber”) and so on.
Once the above is done, our simple report is fully functional, congratulations! This small excursus is over; let’s move back in time and build now DataTable and XML based reports.
Step 2 of 3. Report with DataTable data source.
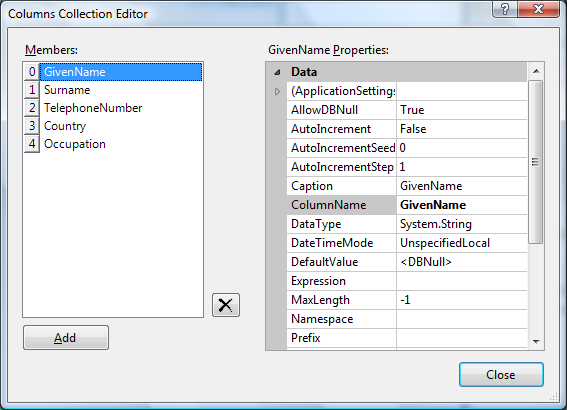
Our “fake users” script creates a table in a SQL Server database, so in the WinForms app we manually set up a DataSet with a DataTable, where we create columns named after the original columns from the script:
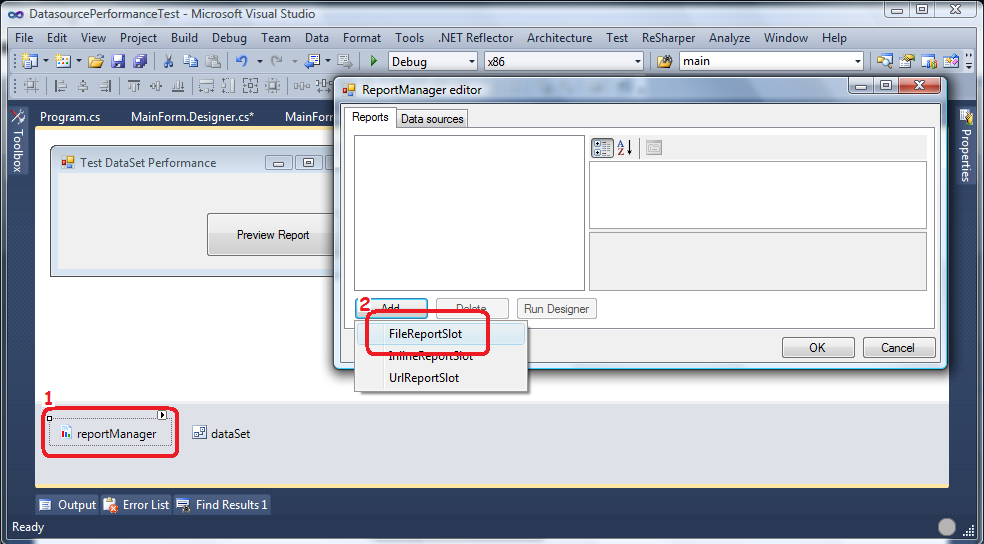
Then we drag-n-drop ReportManager on the form and double-click on it (step 1 on the screenshot below), to bring up “ReportManager editor” dialog. This dialog is the place to manage report slots containing report layout info. Let’s create FileReportSlot: report layout will be stored in a separate file. We click Add button and select the appropriate slot (step 2 on the screenshot below):
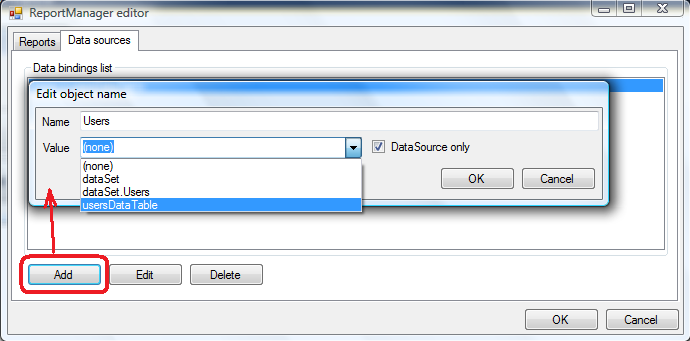
We’d set the file name to ReportLayoutDataTable.rst, and there’s one more thing to do in the “ReportManager editor”: provide a binding name for our data source – in other words, provide a name under which C# object userDataTable will be exposed to the report. Noticed the “Data sources” tab on the screenshot above? That’s the one. Just select the tab, click Add and specify all necessary info:
Now let’s write some C# code to load the data and preview the report:
        private void LoadData()
        {
            var connection = new SqlConnection("Data Source=.; User Id=sa; Password=zzz; Initial Catalog=PerformanceTest");
            var adapter = new SqlDataAdapter("SELECT * FROM fakenames", connection);
            adapter.Fill(usersDataTable);
        }

        private void btnPreviewDataTableReport_Click(object sender, EventArgs e)
        {
            _stopwatch.Start();
            dataTableReportSlot.Prepare();
        }
When the button is clicked, we pull the stopwatch and kick off report generation. Note that here we only start the asynchronous process of preparing the report, and thus also need to implement the “report generation completed” handler:
        public MainForm()
        {
            InitializeComponent();

            LoadData();
            dataTableReportSlot.RenderCompleted += PreviewReport;
        }

        private void PreviewReport(object sender, EventArgs e)
        {
            NotifyElapsedTime();

            using (var form = new PreviewForm((IReportSource)sender)) {
                form.WindowState = FormWindowState.Maximized;
                form.ShowDialog(this);
            }
        }

        private void NotifyElapsedTime()
        {
            _stopwatch.Stop();
            MessageBox.Show("Time elapsed: " + _stopwatch.Elapsed);
            _stopwatch.Reset();
        }
Our handler will stop the stopwatch, display time spent on report generation, and show the report itself. This is all we need on C# side, and if you wonder how to design the report – it’s described above in “Step <unsettled>” above.
So as now we have a fully functional report against DataTable, let’s move on to designing the same report against XML data source.
Step 3 of 3. Report with XML data source.
Alas, fakenamegenerator.com doesn’t offer XML download, but fortunately converting DataTable to XML is a one-liner: myTable.WriteXml(“fakenames.xml”) so we’re lucky. I just run that code once, and then reuse the file.
In fact, report layout can also be reused because just the data source is different. So we copy the previously created ReportLayoutDataTable.rst into ReportLayoutXml.rst and 80% of the job is done.
Cool, looks like file report slots are indeed useful!
This means that now we create another FileReportSlot in Visual Studio designer – let’s call it xmlReportSlot – which will point to ReportLayoutXml.rst we just copied over. Then we double-click on the slot to round out a few things in Report Designer.
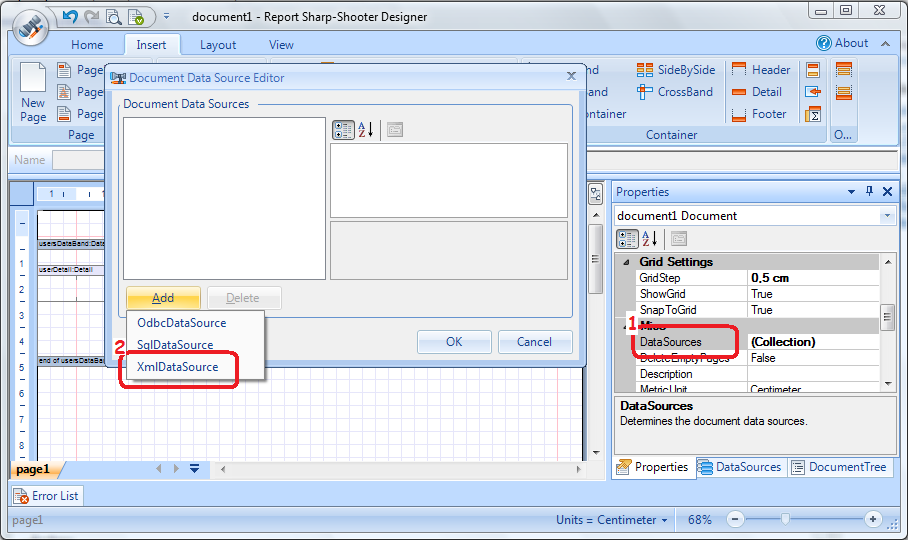
First off, we need to tell that we want to use XML data source: select document element, navigate to its DataSources property and add XmlDataSource:
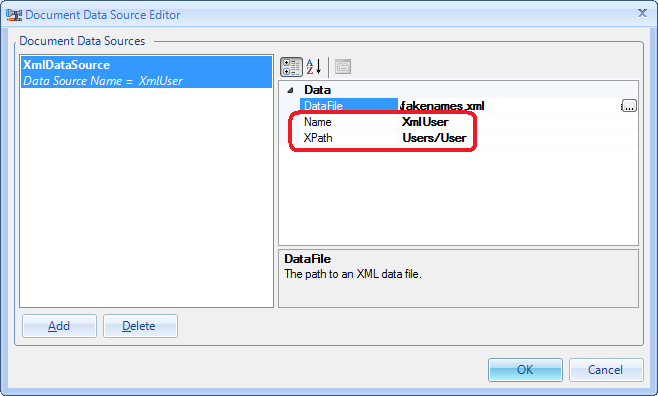
Selecting “XmlDataSource” in the dialog above brings up Document Data Source Editor, where we fill up three fields:
- set DataFile to the previously created fakenames.xml file
- specify data source name as XmlUser (this name has the same meaning as binding name we were specifying while working with DataTables)
- and set XPath property to Users/User. This will allow report builder to access individual xml sub-elements of name/surname/etc values of each “user” element.
Below is a screenshot, just for reference:
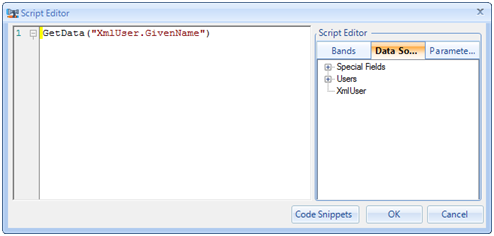
And then recall that our report is nothing but a list of textboxes (txtName, txtSurname, txtPhone, etc) with scripts assigned to them, and each textbox gets the real value at runtime, accordingly to the script assigned. When we were working with DataTable (and our binding was called “Users”), scripts looked like GetData(“Users.Surname”) and GetData(“Users.TelephoneNumber”) and now, with XML data source, it should be different – because our binding is now called XmlUser. The rest stays unchanged:
Ok, now both reports are fully functional, time is ripe for performance comparison. So which one will be faster – DataTable or XML?
Performance evaluation and summary.
To tell the truth, I’m not getting any significant time difference with DataTable vs XML based reports. On my dual core laptop, generating a DataTable based one takes ~0.64 seconds and generating an XML based one takes ~0.68 seconds, on average. A tiny difference for a 5.000 items data source. The way I see it now, choosing DataTable or XML based report is not a matter of time/speed but mostly a matter of convenience. Choose the one you feel most comfortable with!
But don’t take my word for it: download the source code of the test app, play with it, run your own tests and drive your own conclusions. The great thing about software development is that you can dissect any question, come up with an idea, write a small app as an experiment, measure the result and finally prove the idea right or wrong. There’s very little room for speculation. Just run the tests.
Immanuel Kant would be so jealous ![]()