While gleaning analytical insights from a report, the problems you end up dealing with are pretty much dependent on how well you can spot the patterns. And new patterns are almost always discovered by visualizing the data.
We touched this in How to debug scripts in Report SharpShooter highlighting items that “stand out too much”, and in Building a bubble chart with Report Sharp-Shooter with bubble charts, and lately in Logarithmic scale in SharpShooter charts where we revealed patterns visible only on a “log scale” charts.
But the techniques of visualizing are so powerful and variable, and it’s worth writing about them a lot more on this blog down here.
One, perhaps the most common, way of data visualization is histogram, and in this post we’d look into building histograms with SharpShooter.
Quick Theory Reference.
Histograms show the “spread” of your data – that is, how much individual values tend to differ from each other. To generate one, you divide the range of data points into several smaller ranges of equal size (sometimes called bins). Then you count the number of data items in each range.
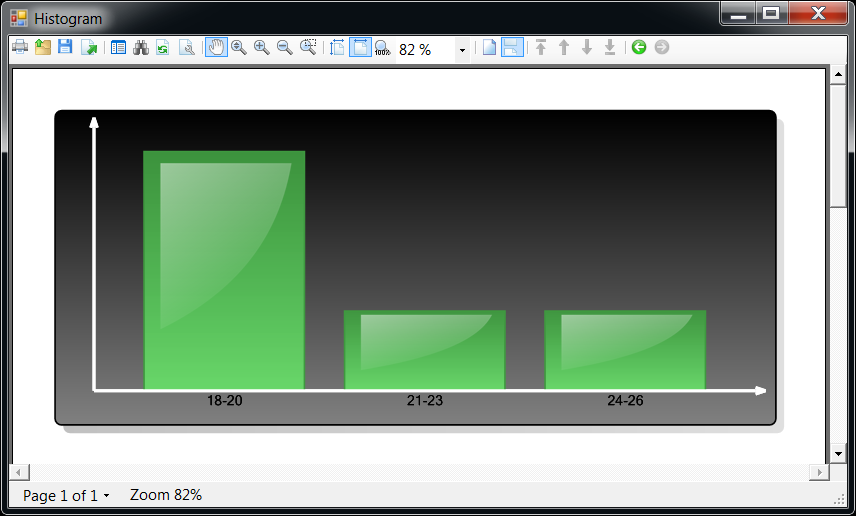
For example, if visitor statistics of your website on 5 consecutive days was {18, 19, 21, 24, 18} you can create 3 bins:
- 18-20: 3 (three items fall into the bin)
- 21-23: 1 (one item falls into the bin)
- 24-26: 1 (one item falls into the bin)
Implementation.
In addition to putting Histogram project on BitBucket which you’re welcome to wander, your humble correspondent created a Nuget package for building histograms with SharpShooter.
This way, the steps to plot a histogram for your data become increasingly simple:
- Create a new project (Console App is fine, too – to make things work we just need System.Windows.Forms to be in References).
- Make sure its target framework is “.NET Framework 4″ and not Client Profile which is default in Visual Studio, because SharpShooter components don’t work in Client Profile yet
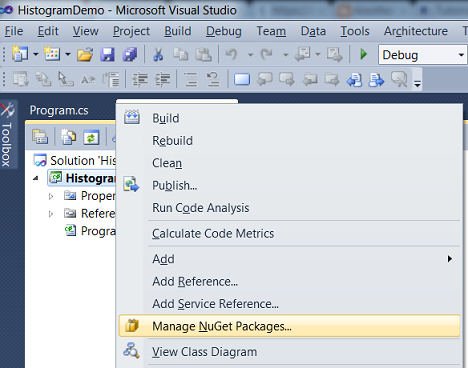
- Right click on the project in Solution Explorer, and select “Manage NuGet packages”:

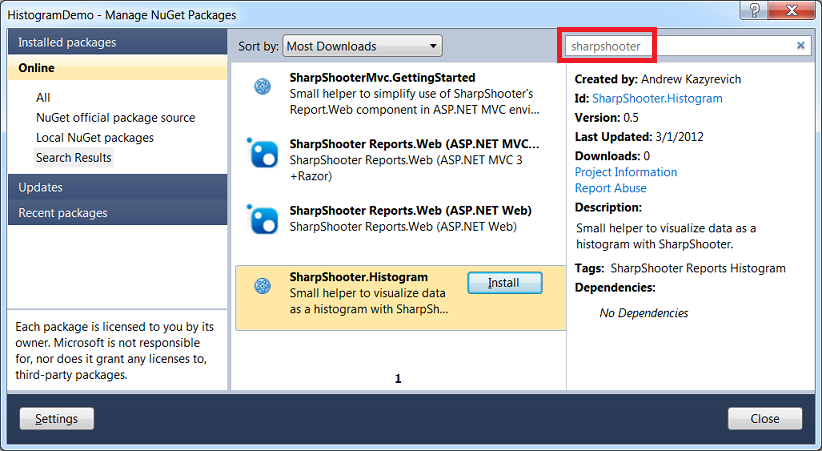
- Type in “sharpshooter” into the search box, and hit “Install” when “SharpShooter.Histogram” project appears:

- Write code for Main:
static void Main() { var visitors = new[] {18, 19, 21, 24, 18}; var dialog = new HistogramDialog(visitors) { Bins = new[] { new Bin(18,20), new Bin(21,23), new Bin(24,26), }, ShowAxisLabels = true }; dialog.ShowDialog(null); } - Run the application and enjoy the result:

More involved example: rolling a dice.
Imagine have a fair 6-sided dice which we can roll – effectively a random number generator for integers from 1 to 6 (note that in code we specify Next(1,7) rather than Next(1,6) because the upper bound is exclusive).
   internal class Dice
   {
      private readonly Random _random = new Random();
      internal int Roll()
      {
         return _random.Next(1,7);  //7 because it's exclusive
      }
   }
Now we roll three of them and generate the data:
   var dice = new Dice();

   var rolls = new List();
   for (int i = 0; i < 1000; i++) {
      var value = dice.Roll() + dice.Roll() + dice.Roll();
      rolls.Add(value);
   }
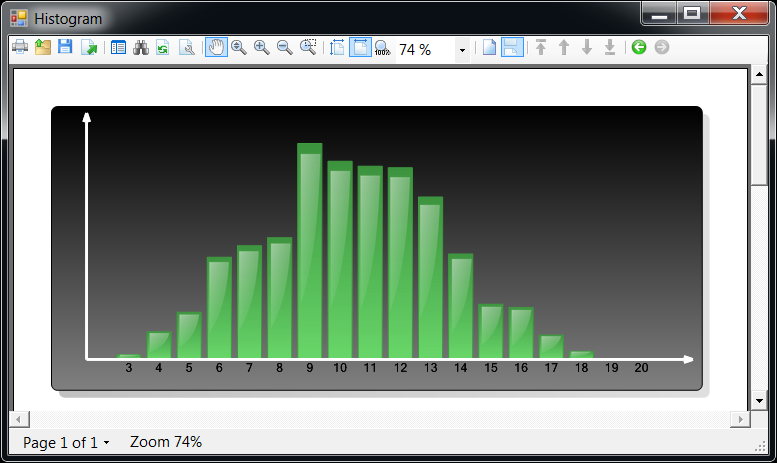
Obviously, there's only one way to get "3" - when all three dice roll out "1" - but there are more combinations to get other results. For a fair dice the probabilities of all results are equal, and so our histogram should be bell shaped with the middle bins getting more "hits" simply because there are more combinations which result in the values corresponding to the middle bins.
So let's generate the histogram:
   var dialog = new HistogramDialog(rolls) {
      Bins = Enumerable.Range(3, 18).Select(x => new Bin(x, x)),
      ShowAxisLabels = true,
      WindowState = FormWindowState.Maximized
   };
   dialog.ShowDialog(null);
..and enjoy the result which supports our hypothesis:

We can take this dice rolling example as a metaphor: in general, if we believe that some outputs are more probable than others (eg, we expect people to buy product X more often than product Y) then the histogram should support the assumptions. And if it doesn't - then the assumptions might be wrong.
Summary.
Data analysis is often thought as a big investment in infrastructure and tutoring, but it's not always true. There are very simple approaches, like building a histogram, which are (or should be!) very accessible. If you weren't plotting histograms due to the lack of tools - with SharpShooter.Histogram package it is a child's play.
What is more important, small building blocks like SharpShooter.Histogram let you quickly start integrating important concepts into your applications, and build serious data analysis tools on top of existing ones.