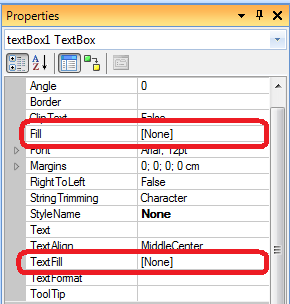
First off, here’s a question: how to highlight a TextBox in Report SharpShooter?
By changing its Fill or TextFill properties, as per the screenshot below:
Oh well, that seems too obvious. Feeling superior, you might say you could have found it without the help of dear blogs.perpetuumsoft.com, and decide to grab a different blog to read the next time you get into the bathtub.
So here’s another question: In a given report, how to highlight the values which fall out the standard deviation interval?
Why standard deviation.
Standard deviation shows how much variation from the average exists in your data.
Given a list of numbers – sales by country, opinion poll outputs, or number of critical bugs, or performance of hedge funds over the year – not only should you consider the absolute values presented, but also analyze the results as a whole.
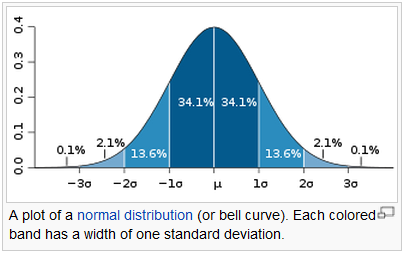
Everything that stands out from standard deviation, is performing much better or much worse than the average, so it screams for your attention. Sales over different regions will differ – but by seeing which areas don’t make it into the standard deviation you immediately know where to apply your lashes ![]() Performance of hedge funds is different, but those who appear within the standard deviation, are doing relatively similar.
Performance of hedge funds is different, but those who appear within the standard deviation, are doing relatively similar.
Hightlight standard deviation in a report.
Well, you will say, not a big deal – a script can do that in a breeze.
But problem is, such script is not an easy-peasy kids’ game, and there might be other requirements complicating it even further. You will most likely need to debug the code to make sure it works correctly. And debugging scripts in a SharpShooter report, despite this blog post title, is not possible.
Sorry guys.
However, your humble correspondent has a better solution! Even though you cannot debug scripts, you may call a method of an external app (as if it was your script code), and that method can be debugged and even unit tested. So, armed with this idea, let’s address the following problem:
Implementation, part 1. Layout and styles.
If you’re comfortable with Report SharpShooter – feel free to skip this section, as it describes the general part of creating a report.
So here we go. Let’s create a new WinForms application, drag-n-drop ReportManager and DataSet on it, and create a two-columns table within the latter. The columns will represent hedge fund names and their respective performance improvements.
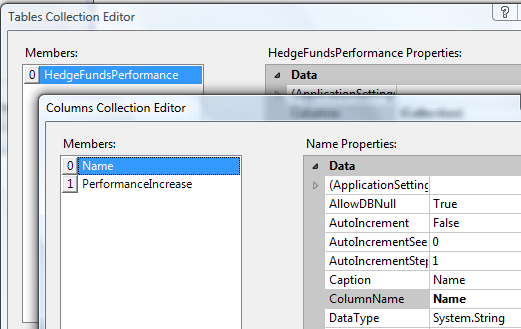
Then we grab the available data from this page I already mentioned, and build it into the data set:
    public partial class Form1 : Form
    {
        private static readonly Dictionary<string, double> _hedgeFunds =
         new Dictionary<string, double> {
            {"Paulson & Co", 11},
            {"Bridgewater Associates", 38},
            {"Renaissance Technologies", 30},
            {"RenTec's RIFF", 22.7},
            {"Millennium Management", 13.3},
            {"Greenlight Capital", 12.5},
            {"SAC Capital", 15},
            {"Pershing Square Capital", 29.7},
            {"Tudor Investment Corp", 7.5},
            {"Appaloosa Management", 22},
            {"Harbinger Capital Partners", -12},
            {"Glenview Capital", 15.3},
            {"Moore Capital", 3},
            {"AQR Capital", 27.3},
            {"Third Point", 34},
            {"JANA Partners", 8.4},
            {"Clarium Capital", -23},
            {"Citadel Investment Group", 10},
            {"Passport Capital", 18.3},
            {"Centaurus Energy", -3.8},
            {"Xerion Fund", 12.66},
            {"BlueCrest Capital", 16},
            {"T2 Partners", 10.3},
            {"Och-Ziff", 8.44},
            {"Perry Capital", 14.6},
            {"HBK Capital Management", 11.62}
        };

        private void LoadData()
        {
            var rows = hedgeFundsPerformanceTable.Rows;
            foreach (var fund in _hedgeFunds) {
                rows.Add(fund.Key, fund.Value);
            }
        }
        ...
    }
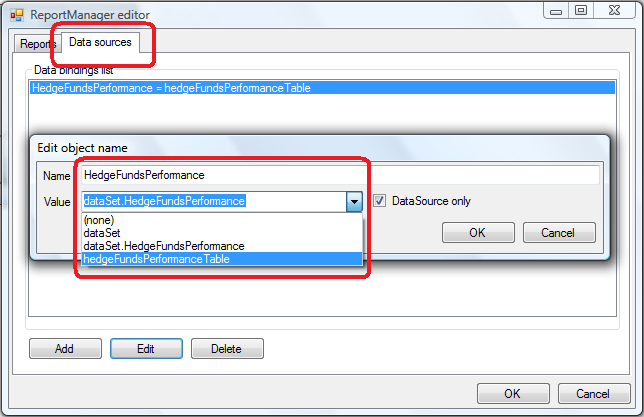
And now let’s create InlineReportSlot (to keep the report layout within Form1.resx), and set its data source to hedgeFundsPerformanceTable we just filled in:
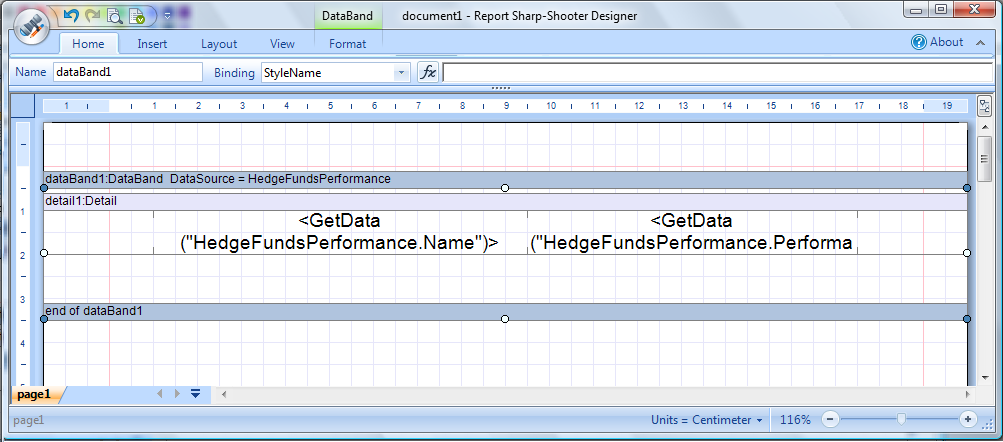
And now we double-click on the report slot to bring up Report Designer, and create a simple report there – just hedge fund name and it’s performance:
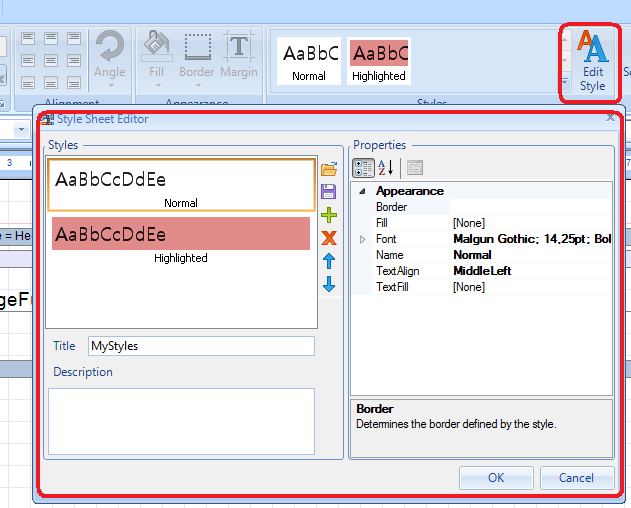
Then we need two different styles for presentation: one, “normal” style, for funds performing within the standard deviation, and the other, “highlighted” style, for outperforming and under-performing ones. We create the styles via the EditStyle button at the top of Report Designer:
We also need to implement the “preview” functionality: drop a button on the form, with the following code:
   public Form1()
   {
      InitializeComponent();

      LoadData();
      reportSlot.RenderCompleted += DisplayReport;
   }

   private void DisplayReport(object sender, EventArgs e)
   {
      using(var form = new PreviewForm((IReportSource) sender)) {
         form.WindowState = FormWindowState.Maximized;
         form.ShowDialog(this);
      }
   }

   private void btnPreview_Click(object sender, EventArgs e)
   {
      reportSlot.Prepare();
   }
Implementation, part 2. External call.
And now the most important question: while in the report, how will we decide which value fits the standard deviation interval and which doesn’t? We will get that from an external method implemented within our WinForms app:
public static bool IsWithinStandardDeviation(object value)
{
    int total = _hedgeFunds.Values.Count;
    double mean = _hedgeFunds.Values.Sum()/total;
    double variance = _hedgeFunds.Sum(x => Math.Pow(x.Value-mean, 2))/total;
    double deviation = Math.Sqrt(variance);

    bool result = (Math.Abs((double)value - mean) <= deviation);
    return result;
}
Note that we could have cached mean and deviation (now they're recalculated on every call) but I'm not caching to keep the code clean. In real world scenario you most likely want to cache.
And as now the external method is implemented, let's call it from the report! We go to Report Designer, and make the style on both textboxes to reflect the result of the external call:
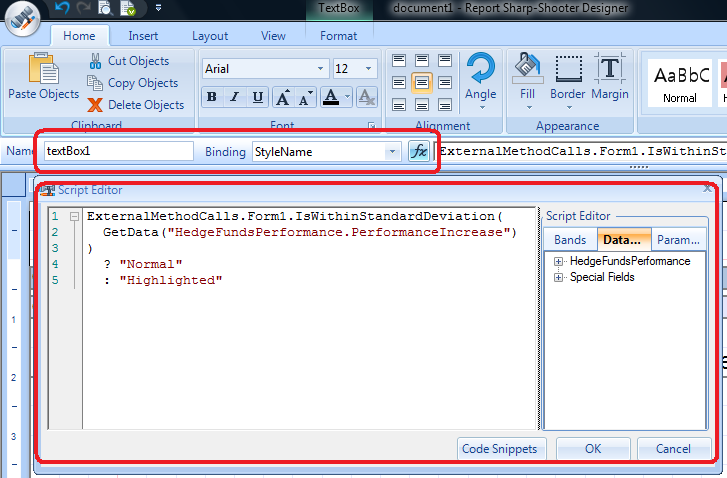
Note that in the external call we specify the fully qualified name of the class and method: our static method is located within Form1 class which is itself located under ExternalMethodCalls namespace.
Final result: debugger and highlighting.
Once all the above is implemented, run the WinForms app in debug mode with a breakpoint set inside IsWithinStandardDeviation, and here's what you will get:
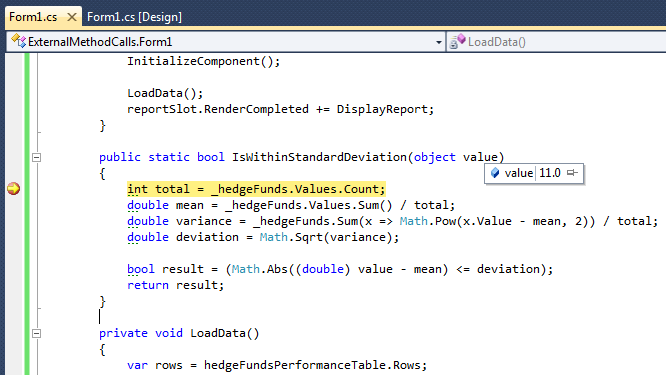
Now guys, isn't that neat? A full-fledged debugging experience, where you can track values of the variables, move back and forth the code with "Set Next Statement", put conditional breakpoints and use a cornuccoppia of other cool features - and, generally, feel less pain while working on your reports. Simply awesome, if you'd ask me.
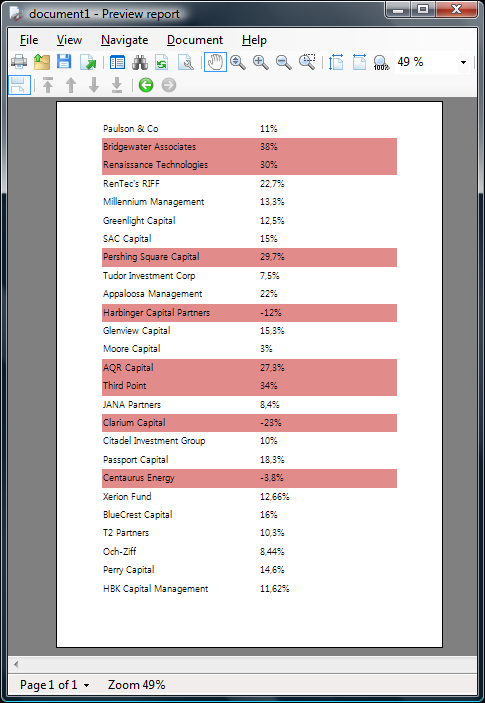
And here's the report you'll see after clicking "Preview" (notice, how easy it becomes to analyze the data with highlighting at hand!):
Summary.
Debugging report scripts in SharpShooter is not possible, but external method calls are a decent alternative: by going that route, you get a full-fledged debugging experience directly in Visual Studio.
General advice of not having complicated scripts in a report, to some extent, is no longer valid with external method calls: complexity of the code is not a problem because you can always debug/trace and even unit test it.
Using external calls also facilitates consolidating "business logic" across your reports. Have a bunch of reports doing similar stuff in their scripts, and ever wondered how you can avoid having a copy of the same script in each of the reports? Now you can move that code to an external method.
Feel free to browse source code of this posts's example on BitBucket, or download it as a .zip archive - and all the best to you on your way to mastering SharpShooter!