In this part of the article I will slightly examine into a report element called a Databand and see the basic workflow.
For a start you can review the previous part of the article “Reports Designer: a challenge or an opportunity? (Part I)” describing basic SharpShooter Reports capabilities.
This essential band serves for the output of elements placed inside it and is practically one of the key elements of report structure since it formats the report data in a regular way a user is expecting, i.e. the data rows come in vertical direction which is common for most types of reports. As we have already known, the datasource should be added to a DataBand through the datasource property. If you don’t have a datasource specified, then the InstanceCount property can be used. Setting this specific property to some numeric value will let the DataBand output its content the number of times the InstanceCount value says. At first, this sounds a bit ambiguous, but after browsing through the Samples Center for examples on its actual use, the idea behind this becomes transparent. Since we don’t have any actual data, we have to generate it by one of our scripts. This usually comes in handy in some testing cases, but, from my experience, there are a number of situations when this property can help you in solving some particular customizations of data output (for example, printing empty columns).
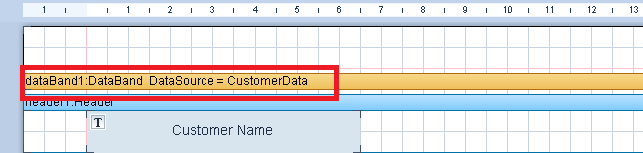
At this point we already know that SharpShooter Reports Designer creates reports by using bands. A band consists of two parts: a band header and the band working area. The DataBand header displays important information about the DataBand. From the header you can see the DataBand’s name and the data source assigned to that DataBand.
As I have already mentioned, bands themselves have no graphical output, only the information inside a band will be displayed on a report. Usually, a single report consists of many band types with different elements in these bands. When a report is printed, or rendered, bands are being copied as many times as required according to the band type. For example, the Header band output occurs in the beginning of a data output and is only displayed once. While on the other hand, a DataBand is repeated for every data record in the database. Since in many situations the report structure requires some complex solutions, the bands can be put inside each other to achieve this. Of course, there are some limitations and not all bands can be placed inside some particular band. The following bands can be used as a container for the DataBand: Page itself (in fact it doesn’t appear as a band), DataBand, BandContainer, GroupBand and SideBySide.
Selecting a DataBand in a report will display a list of DataBand properties in the “Properties” grid to the right of the report body.
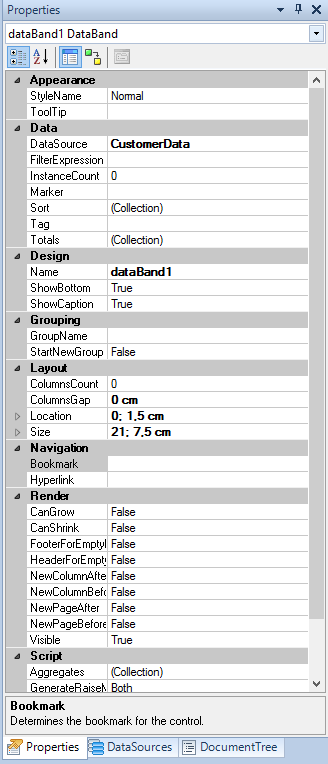
These properties are broken down into different sections shown by a header in bold. You can expand and collapse each section by clicking on a triangle element next to each header. Each line is a different property of the DataBand that you can set. Some of the properties can be changed in other ways, such as the appearance section, since some of the properties in this section can be set through the formatting toolbars available in the Reports Designer. If you are unsure what a property will change, you can select it and read the help text at the bottom of the window.
Actually, accenting each property in detail will take quite an amount of time, that’s why I will only dwell on some of the most intensively used.
Datasource
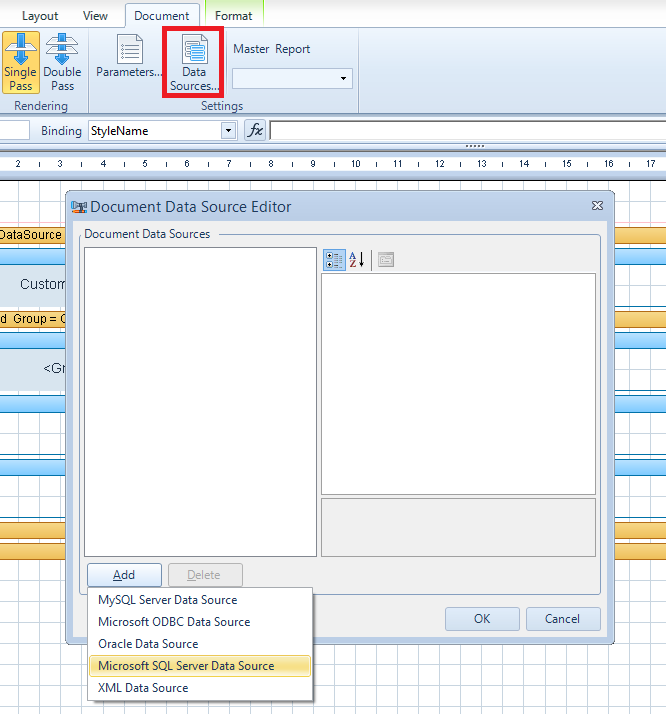
Before you can add data to a report, you must be able to connect to a data source. The data source provides the connection necessary for your report to retrieve the data used to populate its contents. A Reports Designer supports numerous connection types. Connecting to a data source is done through Data Source editor in the Document tab.
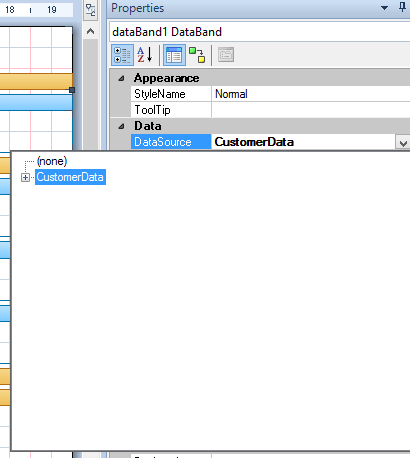
After the connection was established, the data source becomes available through “DataSource” property of the “Data” section.
FilterExpression
In case it is necessary to display the information that fulfills some conditions, we can use a “FilterExpression” property of the DataBand and specify the filter condition in the Script Editor.
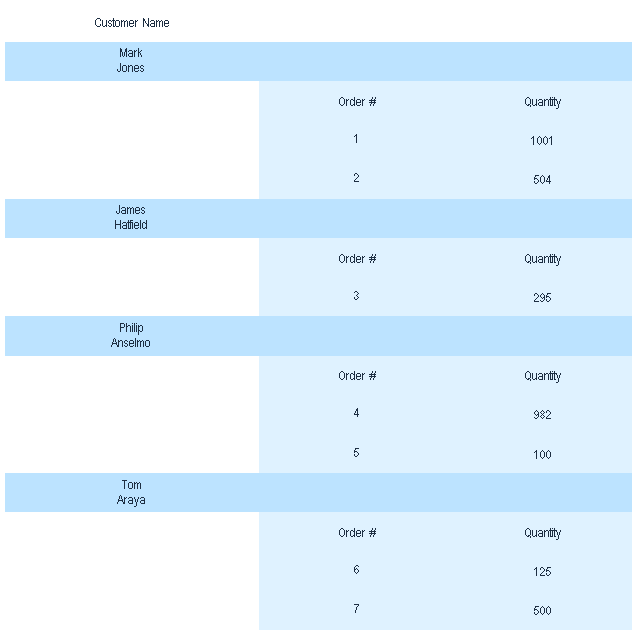
For example, we have the following table displaying the customer’s information from our data source
…and we want to filter the output data according to the Quantity value < 500. This can be done with the following C# script:
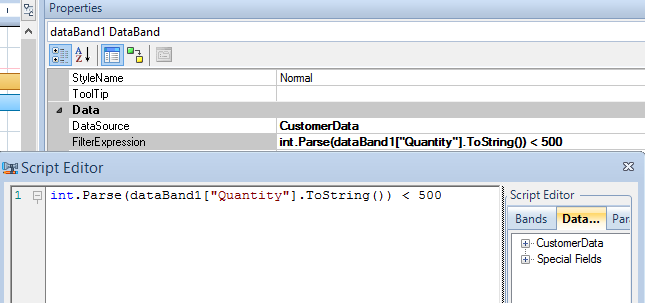
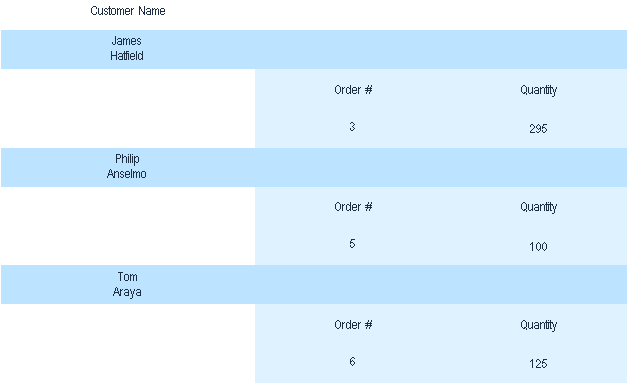
As a result we have our data filtered at the DataBand level. Nothing can be simpler.
Sort
“Sort” property of the “Data” section is used for setting the special data output order. In this case, a script is also used as an expression and the order is additionally specified.
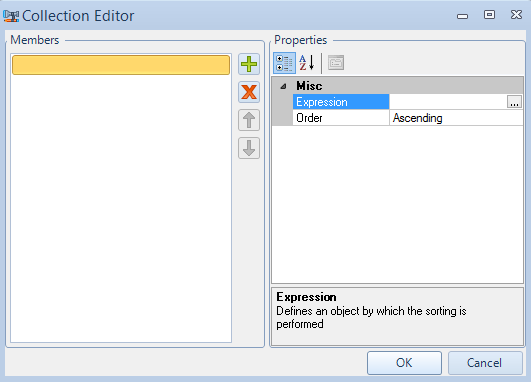
Let’s try to see how it works. For instance, we can sort the customers from our previous example by the “Quantity” field value and see which of those who ordered less than 500 items has the largest number of items in his order.
To begin with, I’d like to present you the template used in my case. Here how it looks.
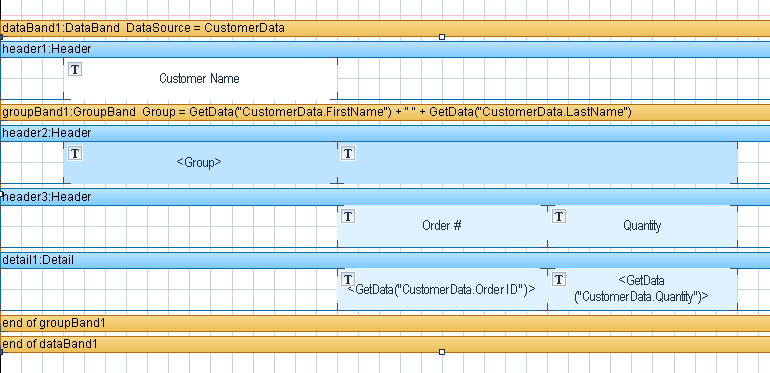
Since my report structure implies the use of GroupBand element which is a parent container for Detail1 element (and in its turn, the Detail1 contains the textbox bound to output the “Quantity” values from the data source), then it would be reasonable to set the SortExpression property of the GroupBand rather than DataBand. We’ll do it as follows:
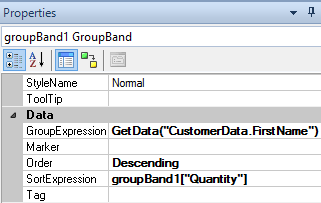
groupBand1[“Quantity”] expression lets us specify the field we use for sorting, while “Order” property defines the records order.
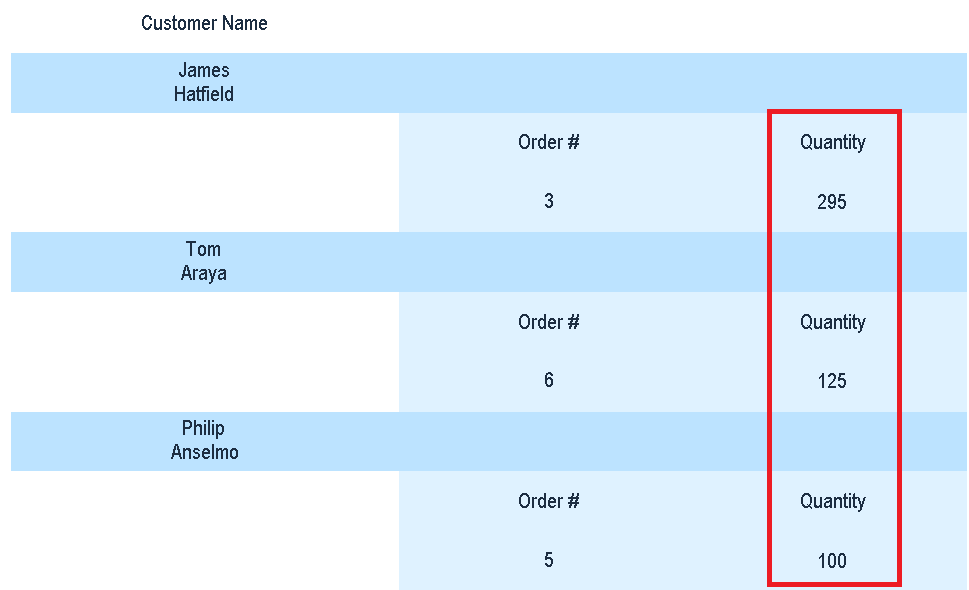
As a result the output looks this way:
Totals
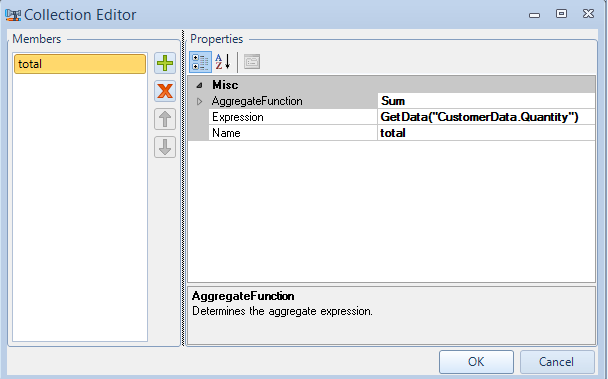
Another quite useful property from the “Data” section is “Totals” which allows setting an expression for summing up the values. The logic here is also quite simple. We specify the AggregateFunction from the drop-down list (in our case we need “Sum”).
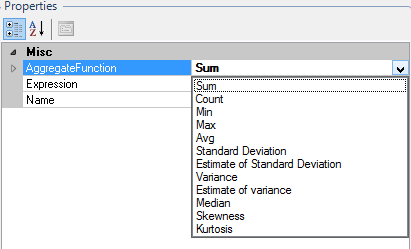
Then, we set the expression, namely we specify the data row that should be summed up (obviously, it’s “Quantity”) and set the name for our expression which should be used in our script for getting the sum value.
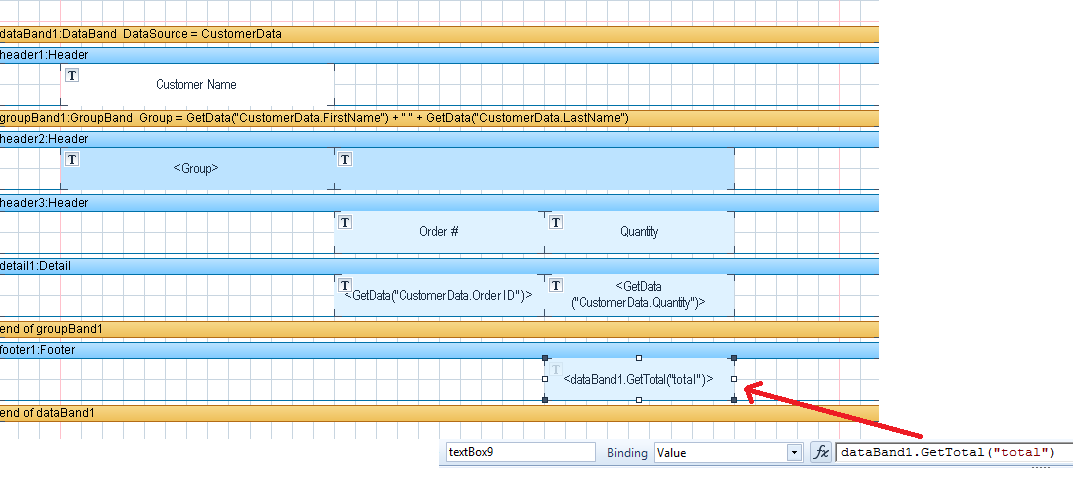
After this, we need to determine the way how to implement this in our report. It seems, that the Footer element would suit just fine in such case. So, after we put the Footer right under our GroupBand (make sure you place the footer inside a DataBand, but not a GroupBand, since it’s behavior in this case would be different), we place one more textbox inside the footer and specify the script for getting the total sum value (in our case it’s dataBand1.GetTotal(“total”) where “total” is the name of our sum expression we specified earlier).
Have a look at the following figures.
Finally, we have the total quantity value displayed.
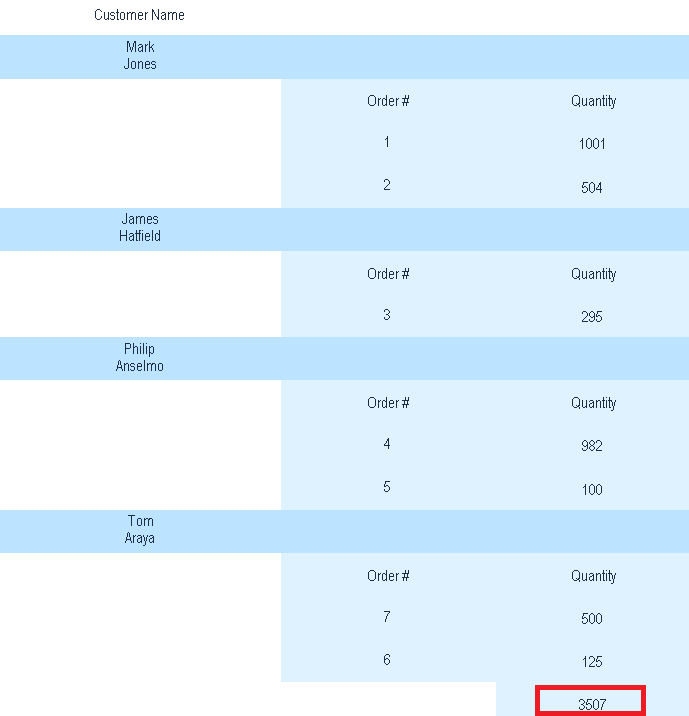
Thus, implementing such function in my report was almost a piece of cake and I really enjoyed it.
To be continued….