This article starts our how-to series offering practical advice on the basics of work with the CrossBand controls in SharpShooter Reports.
Very often our customers feel the need of adding a data table to a report without having any possibility of predefining the table columns list through the Report Designer. In such situations a CrossBand control comes in handy.
The basics
The CrossBand behavior partially resembles the DataBand functions: it can either generate instances (i.e. iterate its content) for every record taken from the specified data source, or generate a particular number of instances, defined with the help of the InstanceCount parameter. It’s very important to remember, that once the data source is specified for the CrossBand, the InstanceCount parameter would be ignored. Unlike the DataBand which generates instances in vertical direction, the CrossBand outputs data horizontally. On the other hand, the CrossBand looks like a Detail control, since it simply cannot store any other containers inside, and is designed to store content as such. During the rendering, the CrossBand is placed in one of the containers (i.e. Header, Footer or Detail). It successively moves through the records from left to right and iterates the content. The height of the CrossBand is defined by the height of the control the CrossBand is placed in.
One of the CrossBand’s features, that a user should take to note, is the CrossBand’s specific behavior related to breaking its content to pages. The CrossBand does not transfer its content to a page below or to a new line (in case the data does not fit the page’s width), but simply creates the so-called ‘cross page’. This page is positioned to the right of the current page and if there’s no need to render the pages located above and below the ‘cross page’, they would be merely ignored during the report rendering.
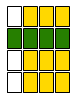
Let’s look at the following sample for further details. Assume our sample report has a CrossBand control that occupies the 4 pages to the right. These pages are marked green on the figure below. The whole report height also counts 4 pages. In theory, our report size is 4*4=16 pages, but only pages marked white and green would be output. The pages marked yellow (the empty ones) would not be rendered, and the final document would contain only 7 pages.
As our practice shows, in certain situations a user can be puzzled with a problem of moving the CrossBand’s content below, rather than creating the pages to the right. Basically, this doesn’t seem difficult to implement. The How-to manual regarding this problem would be available in one of our further articles.
Mechanics in detail
To be able to implement the CrossBand control in a report successfully a user should understand the logic that lies inside this control.
Every container that can store a CrossBand control has a specific parameter which initially equals the value of the page’s margin. Let’s call such parameter a ‘crossOffset’. The rendering of the CrossBand is performed from left to right of the crossOffset’s current value. After the first instance of CrossBand is rendered, the crossOffset value is increased by the width value of the rendered CrossBand. Please note, the rendering of CrossBand is not initiated from the beginning of the page or from the current horizontal position. The rendering starts right from the position where the previous CrossBand stopped being rendered or from the left margin of the page (in case this CrossBand is the first CrossBand in a container). If a single container stores several CrossBands, the latter are rendered entirely in turn, from left to right.
For example, assume we have three CrossBands in a Detail (yellow, green and blue). The yellow CrossBand has three records in a data source. The green one has InstanceCount set to ‘2’. And the blue CrossBand has five records in a data source respectively. The controls would be positioned as shown in the following figure after the rendering.
If we change the InstanceCount property for the green CrossBand and set it to ‘0’, then we would have the following document view after the rendering:
Quite commonly a user would like to set some identation to the left of the first CrossBand or between the first and the second CrossBand , so he/she often may be puzzled by this problem. The solution appears to be really easy – simply put an empty CrossBand of the required width to the left of the CrossBand which is going to be separated, and set the InstanceCount property to ‘1’ for this empty CrossBand. A piece of cake, most would say. And that’s true. As the real practice shows, the CrossBands may be used quite successfully in certain types of reports.
Let’s look into one of such examples.
An example
Let’s assume we have the following data structure and the classes shown below describe the values of some parameters by years.
- public class TableData
- {
- public List ColumnNames {get;set;}
- public List Rows { get; private set; }
- }
- public class TableRow
- {
- public string Name { get; set; }
- public List Values { get; set; }
- }
TableData is passed as a data source for the report. The ColumnNames property stores the column names list (year numbers are used as column names), Rows store the table rows. TableRow has both a Name property (the name of parameter) that should be output in the first column of the table, and the parameters Values list.
The number of year values to be displayed may vary, that’s why we cannot specify the columns in a template beforehand. In this case, the CrossBand comes to the rescue.
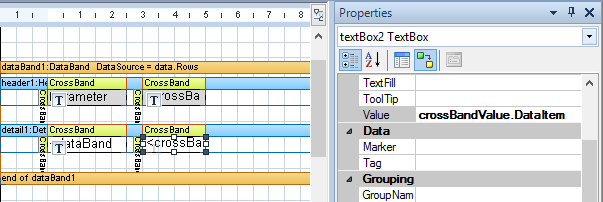
Let’s create a simple template:
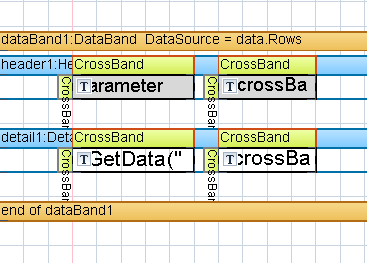
As we see it, the DataBand would iterate through data.Rows. The table header would be output in a Header control, while the data rows would be displayed in Detail.The upper left CrossBand (‘crossBandTopLeft’) is used to output ‘Parameters’ caption above the parameter names. It has a TextBox which contains the ‘Parameters’ text. The InstanceCount property for this CrossBand is set to ‘1’. Please note, in case there was no CrossBand on the right, we could simply put the TextBox right into the Detail control. But in a current situation, such approach is not acceptable as it would result in incorrect content rendering. In other words, the CrossBand content would be rendered over the caption.
The upper right CrossBand (‘crossBandColumn’) outputs the column captions. The data source specified for this CrossBand is ‘data.ColumnNames’. The TextBox inside the control has a binding for the Value property set to ‘crossBandColumn.DataItem’.
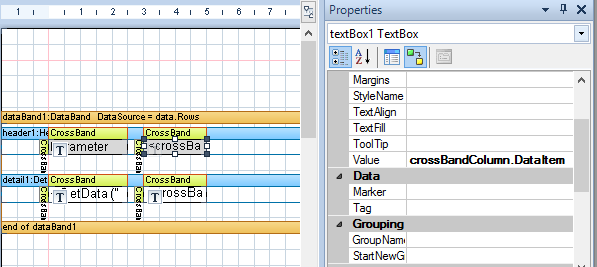
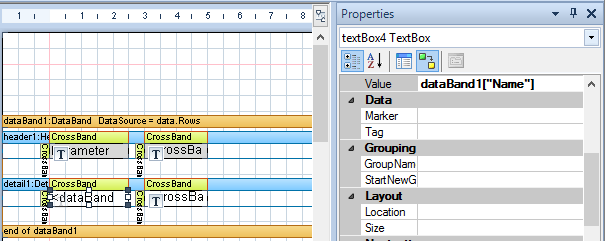
The DataItem property gets the value of the current record from the data source through which the CrossBand is iterating. The lower left CrossBand (‘crossBandName’) outputs the name of the parameter. It has InstanceCount set to ‘1’ and the inner TextBox binding Value is set to ‘dataBand1[“Name’]’.
As for the lower right CrossBand (‘crossBandValue’), it is used to output the values as such. Its data source is ‘data.Rows.Values’, and the inner TextBox binding Value is set to ‘crossBandValue.DataItem’.
In such way, we were able to display the following table after the report was rendered:
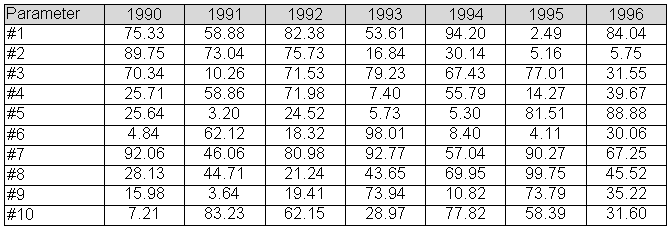
It’s almost as easy as anything.
The sample Visual Studio solution is available under the following link: http://perpetuumsoft.com/Support/downloads/samples/CrossBandSample.zip