Having started to describe the bevy of grouping and sorting strategies here and here, we somehow missed the very basic (yet powerful) grouping options natively available in Reports SharpShooter.
So let me make up for this remarkable omission, and tell you how to group items in a report via GroupBand, a SharpShooter’s grouping container.
Step 1 of 3. Setup data source.
We’ll use a list of cities and countries as a data source – with the aim to display cities grouped by their respective country. The script below would generate all the data for your convenience:
CREATE DATABASE Test
GO
USE Test
CREATE TABLE Countries(
	Id BIGINT IDENTITY(1,1)PRIMARY KEY CLUSTERED,
	Name NVARCHAR(20) NOT NULL
)
GO
CREATE TABLE Cities (
	Id BIGINT IDENTITY(1,1) PRIMARY KEY CLUSTERED,
	CountryId BIGINT NOT NULL,
	Name NVARCHAR(20) NOT NULL,
	Population DECIMAL(4,2) NOT NULL,
	FOREIGN KEY (CountryId) REFERENCES Countries(Id)
)
GO

INSERT INTO Countries (Name) VALUES
	('Belarus'),
	('Russia'),
	('Spain')
GO

INSERT INTO Cities (Name, CountryId, Population) VALUES
	('Minsk', 1, 1.9),   ('Brest', 1, 0.3),    ('Lida', 1, 0.09),
	('Moskva', 2, 11.5), ('Murom', 2, 0.11),   ('Barnaul', 2, 0.61),
	('Madrid', 3, 3.26), ('Barcelona', 3, 4.4), ('Las Palmas', 3, 0.64)
GO
Step 2 of 3. Setup report template.
Having run the above script, we can now use powershell (as explained here) and scaffold a report:
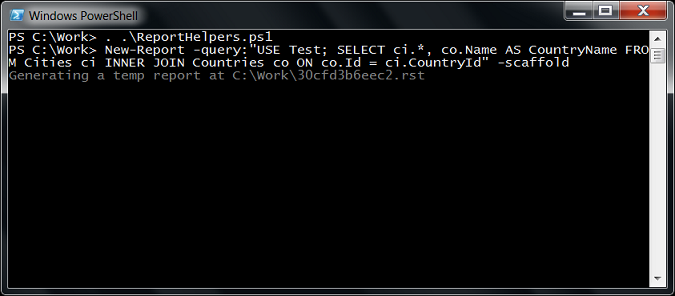
The above command will automatically generate a fully functional report template (ie, “Preview Report” would display the cities we had inserted):
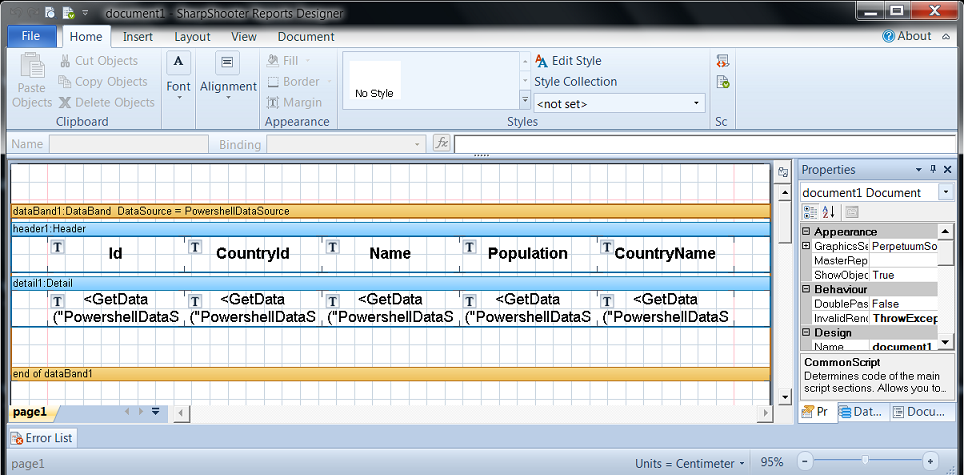
Now we just need to tweak the template a bit. We drag-n-drop GroupBand onto the scaffolded DataBand:

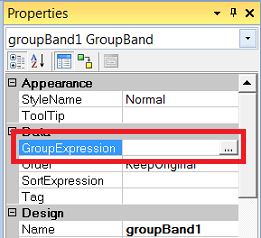
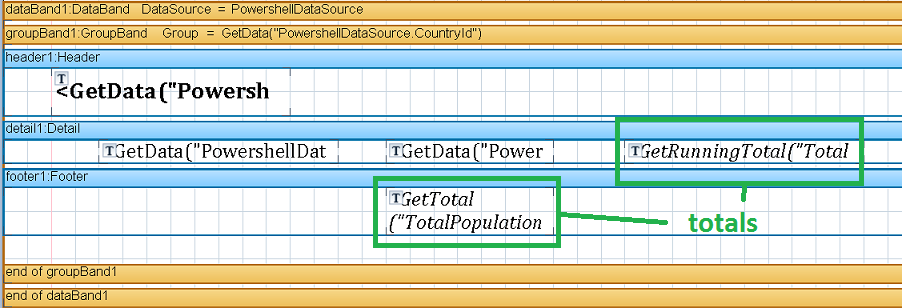
..and put GetData(“PowershellDataSource.CountryId”) in its “grouping expression” because we want to group cities by their countries:
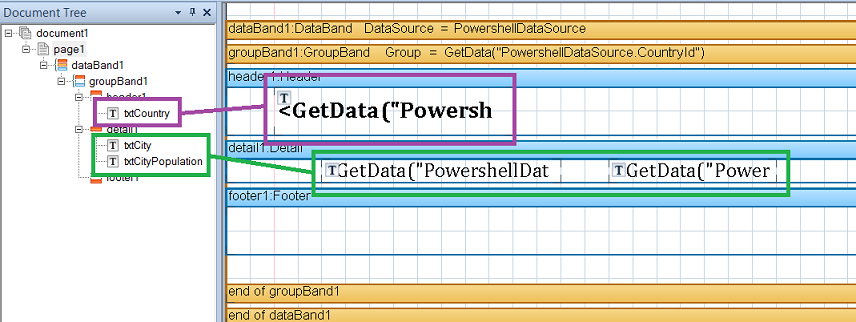
Next, we just move the data textboxes we need and set up the “header-detail-footer” structure in the GroupBand as per the image below:
Now, when we run the preview, it will show the grouped items:

Step 3 of 3. Totals and running totals.
As usual with SharpShooter, basic functionality is accompanied with a range of powerful aggregating routines, called “totals” (which, it seems, should have been branded under the more broad name “aggregates”). To set up a “total”, we go to DataBand and add a new item to its Totals collection:
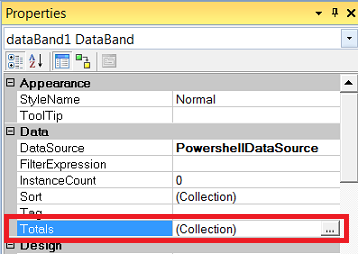

The aggregate function of our choice above is Sum but there’s no shortage of other options (eg, “standard deviation” if you want to output the values in a “±” format, or “kurtosis” if you want to highlight how flat is your data distribution).
After defining the total item, we add a footer textbox with the value of GetTotal(“TotalPopulation”), where the GetTotal method is a built-in SharpShooter routine for accessing the “totals” object by its name.
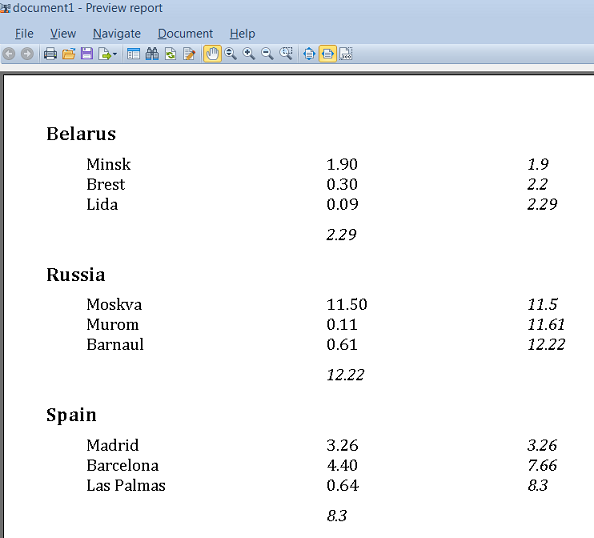
Then our preview would have subtotals by country highlighted in italic:

We obviously can also get fancier and calculate the running total via GetRunningTotal routine. In this case out template will look like this:
..and the preview would look like this, with the rightmost column listing the running total within each group:
Summary.
Simple aggregation tasks are winningly easy with SharpShooter: all you need is a GroupBand container and a few textboxes.
After you wrap the data into a group band, you can use GetTotal to display a total for the given group (again, the name “total” is a bit misleading as it could be the average, or variance, etc) – or, on top of that, you can also use GetRunningTotal to display the running totals within each group.