Customer bio
My name is Ethan Schaefer. I’m a Ph.D. candidate at the Lunar and Planetary Laboratory at the University of Arizona in Tucson. My professional interests cover a wide range of planetary geology, but this particular project focuses on lava flows. (To be clear, I mean lava flows that have long since stopped flowing. I suppose one could call them “fossil” or “solidified” lava flows, but neither of those terms is used in science.)
The Science
Planetary science has always been hampered by the problem of resolution. Our very best satellite imagery today (HiRISE for Mars, run by my advisor, and LRO NAC for the Moon) achieve resolutions of 1-2 m (corresponding to a pixel size a few times smaller), but most planetary data is of far lower resolution. In terrestrial geology, one of the most basic and most useful observations of a lava flow is its type, traditionally divided into two “end member” textures: ropey lava, called pāhoehoe, and rubbly lava, called ‘a’ā. In practice, between these two end members, there is also a very complicated and not fully understood menagerie of other textures. The problem lies in the fact that all of these textures are defined at sub-meter scales, so how can we identify them from orbit?
Radar provides one way, but in essence, radar only tells you the roughness at a particular scale, determined by the wavelength of the radar itself. For example, a radargram may tell you what the roughness is at exactly 12 cm, but not what that roughness is at 6 cm or 24 cm. We quantify such scaling of roughness by a measure called the Hurst exponent, and I’m exploring whether that value can be inferred from orbital imagery alone. There are also many planetary surfaces for which we have no radar data. For these surfaces, the technique that I’m developing is one of the only means to characterize flow roughness and type.
The idea is this. From earlier work by Barbara Bruno and her co-workers, we know that the outlines of lava flows, as viewed from above, are fractals. In other words, the outline has a similar shape when viewed across a range of scales. For reference, coastlines are also fractals; they have similar jaggedness at global scales, national scales, and local scales. Based on work I did in Iceland last summer at the 2014 Holuhraun flow, we now know that lava flows can be nearly perfect fractals, such that even low-resolution orbital observations at 100 m per pixel could tell us the shape of the flow at sub-meter scales. The exciting prospect is that there are good reasons (including theoretical arguments and qualitative observations) to believe that this sub-meter margin geometry could correlate with the roughness scaling (Hurst exponent) of the lava flow’s surface, and thus that we could characterize sub-meter roughness given nothing more than low-resolution orbital imagery! To test this idea, I have been collecting very precise (better than 1 cm) GPS data in Hawaii, Iceland, and Idaho describing both the margins of lava flows and topographic profiles across their surfaces. If I can develop a robust technique for inferring flow roughness and type from orbit, it would significantly help fill in the gaps of our knowledge of the history of volcanism on Venus, Io (a moon of Jupiter), and potentially other planets.
The Need for MobiDB
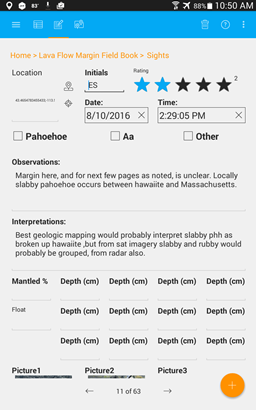
During earlier work in Hawaii and Iceland, I’d come to realize just how essential it was to take notes in the field almost constantly. The nature of my work also required each of these notes to be pinned to a very specific location. However, tediously writing down GPS coordinates for every note, often also measuring compass direction and logging image numbers from my digital camera, was time-consuming. Additionally, there is no fast way to query written notes nor turn them into geospatial data (e.g., a shapefile) when I get back to the office. Beyond this, when I return to Hawaii in a week to continue field work there, I plan to take multiple measurements of sediment thickness at many sites. It would be ideal if basic statistics of those measurements (mean and standard deviation) were available to me in real time in the field.
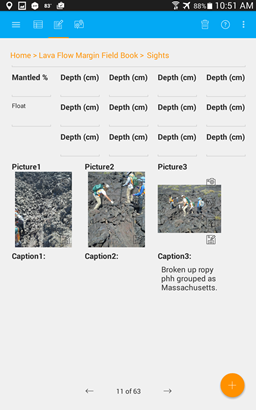
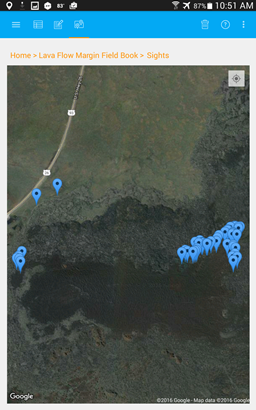
The answer to all of these issues is a digital notebook. I experimented with a large number of Android apps, from pure note-taking apps (like Evernote) to database apps before finding MobiDB to be an excellent fit. MobiDB’s simple and powerful template designer is essential to me, its ability to store images within the database is extremely useful, and its GPS functionality and map display are as unique as they are necessary for field work. When carefully coupled with third-party apps (e.g., geotaggings photos), MobiDB can’t be beat as a digital field notebook, in my opinion.
 |
The Field Test
With my carefully crafted but untested MobiDB database in tow, I and four colleagues (one undergraduate, two graduate students, and one post-doc together representing the University of Arizona, Arizona State University, and Colorado State University) deployed to Craters of the Moon National Monument and Preserve in Idaho Aug. 8-12 as part of a larger NASA-funded group called FINESSE (http://spacescience.arc.nasa.gov/finesse/). Everyone was impressed by MobiDB, and I personally found it indispensable. I consider the field test a complete success, and I hope I’ll never have to use a paper field book again. Beyond the time-saving and functionality benefits that I already listed, I can also back up my field book every day, keep redundant copies, and share copies with colleagues, all of which would be impossible (or extremely difficult) with a paper field book.

|

|
Even though my focus is scientific use, I believe that MobiDB can be easily used in a wide range of outdoor activities, including outdoor education, hiking, boy and girl scouting, hunting and fishing, etc.
I think Mobi DB has excellent potential for widespread use as a digital field notebook, and I look forward to trying it again when I deploy for fieldwork in Hawaii next month.
Thanks for creating this great software, and I’ll be eagerly watching it for improvements!
 |
 |