Today’s most recent and popular trend in corporate business intelligence is real-time data monitoring with digital dashboards and scorecards. They provide all necessary information at a glance: charts will help you see tendencies; KPIs will let you know if the situation is stable or needs your special attention.
As it was mentioned in one of the previous articles, appropriate use of gauges and other data visualization elements in corporate statistics helps save considerable amount of employees’ time. Current financial situation all over the world makes companies of all size reduce expenses. And first of all they reduce IT and BI budgets; and it means that advanced and promising technologies that can help companies increase ROI and save won’t be implemented in the near future and may be will never be implemented. So, this is an endless circle: reduce budget for technologies that can save – low RIO – low profit – no money to implement new technologies.
So, maybe it is quite time to invest in such technologies, as dashboards, that help reduce expenses and increase RIO today, to win tomorrow.
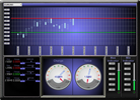
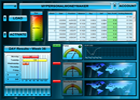
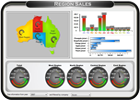
So, to get an idea of what digital dashboard is, what data can be monitored, how KPIs can be designed, review the following samples.
Keep in mind that we can help you design the very dashboard you need addressing all your requirements. Invest today – Win tomorrow!


There is obviously a lot more to figure out about this issue, but you made some really good points. I will definitely be checking here more often. Thank you.